Sports data visualization with a hybrid design utilizing big data analytics and Artificial Intelligence
Authors :
Alhassan Adamu
Address :
Department of Computer Science, Aliko Dangole University of Science and Technology, Wudil
Abstract :
The knowledge of group tactical behavior has grown into a crucial component in the field of athletic data analysis and visualization at this point in time. In order to make effective use of the ever-increasing volumes of complex information, collaborative and automated information analysis is of critical importance. One of the most common methods utilized in professional team sports is the collection and examination of data pertaining to the monitoring of athletes. The purpose of this exercise is to investigate tiredness and the following adaptive reactions, as well as to conduct an analysis of performance potential and to reduce the likelihood that damage and disease will really occur. For the purpose of the continued development of fitness goods that are based on artificial intelligence (AI), the data visualization software that was developed during the era of big data analytics provides a solid framework for the development of these products. Consequently, the objective of this study was to offer an effective video visualization framework based on artificial intelligence and big data analytics. This framework is called the HybridAI Sports Visualization Framework (HybridAISVF), and it was designed to improve the visualization of sports data. For the purpose of this study, the technology of machine learning is utilized to classify the sports video. This is accomplished by extracting both the temporal and spatial properties of the films. Our approach is built on a foundation that is comprised of a combination of temporal pooling layers and convolutional neural networks. The findings of the trials indicate that the Hybrid AISVF model, which is recommended, significantly enhances accuracy, recall, precision and F1-score in comparison with the other models that are currently being utilized.
Keywords :
Sports Visualization; Big Data; Sports Data Analysis; Artificial Intelligence; Video-Based Visualization; Risk Reduction.
1.Introduction
Understanding and analyzing the collective tactical behavior of athletes in the realm of sports is made significantly easier with the utilization of sports data visualization [ 1]. Because of the exponential increase of data in the sports sector, analysis of data that is both interactive and automated has become a vital tool for efficiently harnessing complicated information[2]. It is common practice in professional team sports to collect and analyze data on sportsperson monitoring in order to evaluate tiredness, adaption responses, performance potential, and to reduce the likelihood of injuring or becoming ill. As a result of the combination of AI and big data analytics, the analysis and visualization of sports data has been completely transformed [3].
During the period o f big data analytics, the development of data visualization technology has provided a solid platform for the creation of increasingly sophisticated fitness programs that are powered by artificial intelligence [4]. In order to make further progress in this area, a novel approach that has been proposed in this study is known as the HybridAI Sports Visualization Framework (HybridAISVF). By extracting both temporal and spatial information from the film, the HybridAISVF has the ability to classify sports videos through the utilization of machine learning techniques [5]. Enhanced analysis and presentation of sports data is achieved through the utilization of this architecture, which incorporates convolutional neural networks and temporal pooling layers.
The Hybri dAISVF model has been shown to have considerable benefits in terms of accuracy, recall, precision and F1 score when compared to other models that are currently in use [6]. These studies were conducted. In order to provide stakeholders with a comprehensive solution for sports data visualization, the HybridAISVF combines the power of artificial intelligence and big data analytics. This allows stakeholders to obtain deeper insights into performance indicators, decrease risks, and optimize decision making appro aches [7]. This revolutionary framework not only improves the interpretation of complicated sports data, but it also prepares the way for innovative applications in the sports sector, such as risk reduction, performance analysis, and strategic decision mak ing [8].
In the final analysis, the HybridAI Sports Visualization Framework is an innovative approach to the visualization of data in sports. The Framework demonstrates the potential of AI and big data analytics to fundamentally alter the manner in which sports data is evaluated [9], interpreted, and utilized. This framework has the potential to revolutionize the way in which sports professionals, analysts, and stakeholders interact with data [10]. As a result, it will lead to improved performance outcomes and greater decision making capabilities in the ever changing universe of sports. The main objectives are:
- • To develop a hybrid design framework, HybridAI Sports Visualization Framework (HybridAISVF), integrating artificial intelligence and big data anal ytics for sports data visualization.
- • To utilize machine learning techniques to classify sports videos by extracting temporal and spatial characteristics to enhance data analysis and visualization.
- • To implement convolutional neural networks and temporal pooling layers as the foundational components of the HybridAISVF system for improved performance metrics.
- • To analyze and interpret sports data to understand collective tactical behavior, analyze fatigue, adaptation responses, performance potential, and mitigate risks of injuries and illnesses.
A summary of the research is provided below. In Section 2, the current literature and study techniques are thoroughly examined. The research strategy, methodology and processing procedures are detailed in Section 3 . The results analysis is covered in Section 4. Part 5 explores the main conclusion and Future work.
2. Literature Survey
D’Urso et al. [11] offered up the ability to make informed decisions in many facets of professional sports, which is being improved by th e collection and analysis of sports data from both physical and digital sources. The health and safety of players, the involvement of fans, marketing tactics, income, sports economics, sports practice, and overall wellness are all part of this. The Interne t of Things (IoT), social media, and both public and commercial organizations are among the data sources. The sport, the data, and the analytic aims dictate the statistical learning and operations research methodologies that are presented. Match and traini ng data helps identify what elements affect team and player success, while fan data affects marketing and decisions. The efficiency of the gambling market can also be managed with the use of sports data.
Afzal et al. [12] provided with the goal of enhancin g the capacity for decision making in many facets of professional sports, data is being gathered and understood from both digital and physical sources. Performance, safety, marketing, income, health, economics, practice, and overall well being are all part of this. Organizations both public and private, as well as the Internet of Things and social media, are data sources. Proposed methods include statistical learning and operations research, tailored to the specific sport, data, and analysis objectives. Pla yer and team performance related elements can be better understood using data collected during training and games, while data collected from spectators can have an impact on marketing and decision making. There is a potential for sports data to be utilized in the management of gambling market efficiency.
Mohapatra et al. [13] presented the Games are often complex and employ a lot of space, making them good standards for AI strategy. In general, video games use strategies to make them more engaging, immersiv e, smarter, etc. The two are excellent recreations by AI. Since there aren't many programmatic viewpoints on the state of activity AI, one can do some research into what appears to be the current state of software based activity AI fields, including effect ive agents in studies of non player characters and recreation level technology in procedural content fabric generation. We introduce a process that visualizes the rules of a game using AI based techniques. Additionally, research is being on AI for everyday tasks and hybrid brilliance for video games.
Baumer et al. [14] presented Professional and academic sports analytics have grown over the past thirty years. In this article, game state expected value, victory probability, team strength measurements, and sp orts betting market data are discussed across sports. The need for statistical methods, computational tools, and data sources is highlighted as it compares analytical approaches in each sport. Sports analytics are covered in the article; however, player ev aluation is not.
Agarwal [15] discussed that various aspects of the sports industry today and in the future strive to hit the bull's eye to bring about AI's ideological revolution and enable industry growth. It gives a non technical overview of the ML par adigm to inspire sports analytics improvements. Early detection or prediction can help treat or avoid many sports injuries, such as muscle strain. AI adoption in a sports league may depend on teams and players sharing private data or visions. Sportswear ha s been fashionable recently. With famous athletes wearing and endorsing top companies, sportswear is everywhere.
Raabe et al. [16] investigated Tactical Graphs (TGNets) as a different graph based structure for examining invasion game tactical trends with m ulti agent spatiotemporal data. A lightweight hybrid ML method that is sensitive to player interactions is proposed by the authors, Tactical Graph Networks (TGNets). They test TGNets on actual football data and discover that, despite being less complex, th ey perform as well as top tier deep learning models. Finding the correct data representation for model performance is a key finding of the study.
Shorman et al. [17] delved into the COVID 19 pandemic's effects on education, especially in the Arabic speaki ng world. A key strategy for imparting knowledge and abilities is the rise of self study through online resources. The purpose of this research is to analyze and rank Arabic language learning websites according to their features, ease of use, and instructi onal material. It does not evaluate computer systems but rather Arabic language learning websites, categorizing them using quantitative and qualitative methodologies.
Liu et al. [18] Presented the Sports have garnered the attention of the general public as a result of the diversity of training methodologies and the requirement for remote health surveillance techniques. This research presents a multimedia medical information exploration and visualization (IHDEV) methodology for improved multi scaling visuali zation and analysis of data in sports health vision systems. The model's design is tri layered, with data acquisition occurring in the first layer and processing and visualization occurring in the second and third tiers, respectively. Experiment results sh ow that IHDEV can improve healthcare based sports monitoring by lowering error rate and increasing accuracy, prediction, and effectiveness while the coefficient of Pearson correlation compared to traditional models.
Li et al. [19] showed the realm of wel lness, particularly in the realm of sports, the Internet of Things (IoT) presents a tremendous opportunity. The use of wearable technology to monitor physical factors is becoming increasingly common, with the goals of improving health and increasing compli ance. This study suggests that Internet of Things based fitness tracking systems have the potential to incorporate sports activity monitoring utilizing big data visualization (SAM BDV). During physical activity, the device properly monitors the user's hear t rate, breathing frequency, and motion rate. This helps to reduce the expenses associated with processing while still meeting the necessary health criteria. Using the strategy that has been suggested is not only simple, but it is also dependable and econo mical.
3. A Model for HybridAI Sports Visualization Framework (HybridAISVF)
One of the most cutting-edge approaches to sports data analysis and visualization is the HybridAISVF that has been proposed. This framework makes use of AI and big data analytics to improve the understanding of collective tactical behavior, performance metrics, and injury risk mitigation in professional team sports. The HybridAISVF model is intended to classify sports videos by extracting both temporal and spatial data. It does this by employing machine learning approaches to enhance accuracy, recall, precision, and efficiency metrics in comparison to other models that are currently in use. The combination of CNN with temporal feature layers is the fundamental component of the HybridAISVF model. This integration makes it possible to extract high-level characteristics from sports video data. In order to enhance decision-making processes and increase performance results in the sports business, the framework intends to provide a holistic solution for sports professionals, analysts, and stakeholders. This will be accomplished by mixing artificial intelligence algorithms with big data analytics.
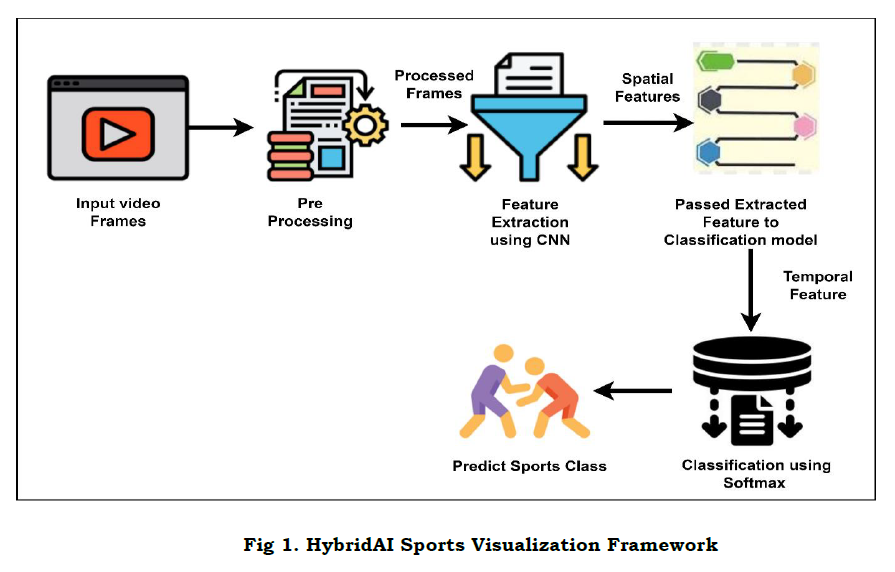
In figure 1, In order to support thorough analysis, the HybridAISVF model begins with the acquisition of a wide variety of sports video datasets. These datasets encompass a wide range of temporal and geographical properties within the sports video. The stage of data preprocessing entails cleaning and standardizing the video data, extracting features that are pertinent to the study, and preparing the dataset for future examination. The forecasting skills of the model are then improved by using sophisticated feature extraction techniques to the sports videos in order to identify important temporal and spatial patterns as they appear in the movies.In order to construct the HybridAISVF architecture, it is necessary to design and implement a hybrid framework that integrates components of AI and big data analytics. Using ML methods, the model is trained on the preprocessed sports video data. The primary focus of the training is on optimizing parameters in order to increase performance metrics. For the purpose of determining whether or not the model is useful in improving accuracy, recall, precision, and efficiency, evaluation and validation approaches are utilized. These techniques include cross-validation and testing on data that has not yet been seen.
The advantages and enhancements that the HybridAISVF framework has attained are brought to light through a comparative examination with other models that are currently used in sports data visualization techniques. The findings of the experiments show that the HybridAISVF model performs exceptionally well when it comes to comprehending collective tactical behavior, assessing fatigue, and lowering the likelihood of injuries occurring in professional team sports. In the ever-changing sports business, the framework offers vital insights to stakeholders, which enables them to make educated decisions and optimize their performance.In conclusion, the HybridAISVF (HybridAI Sports Visualization Framework) that has been proposed is a significant improvement in the field of sports data analysis and visualization. The HybridAISVF model provides a comprehensive solution for understanding and analyzing sports video data, improving decision-making processes, and maximizing performance outcomes in professional team sports. This is accomplished through the utilization of AI and big data analytics. The framework is a valuable tool for sports professionals, analysts, and stakeholders who are looking to get deeper insights into sports data and improve overall performance in the sports business. Its creative methodology and superior performance metrics establish it as a valued tool.
1) Sports Visualization Model for Big Data
The Big data-based sports visualization model comprises five layers: Application, Data Analysis, Central Repository, Data Collection and Exchange, and Data Source. The Application layer provides a user-friendly interface for data analysis, while the Data Analysis layer collects and evaluates data from various sources. The Data Collections and Exchange layer collects and exchanges information, while the Data Source layer ensures data precision and dependability.
Application Layer: The Application Layer is the highest layer in the Big data-based sports visualization model and this layer is the one that interacts with consumers and stakeholders. Accessing and interacting with the sports data visualization system is made easier by the user-friendly interface that it offers. This layer consists of applications, dashboards, and tools that give users the ability to examine visualizations, generate reports, and make decisions based on data based on the insights that are derived from the analysis. Individuals have the ability to personalize their views, establish their preferences, and gain access to a variety of features in order to properly examine and evaluate sports data.
The Data Analysis Layer: The Data Analysis Layer is in charge of collecting and evaluating the sports data that gets gathered from a variety of different sources. The process entails the utilization of statistical tools, machine learning algorithms, and data mining approaches in order to extract insights and patterns from the data. The purpose of this layer is to generate meaningful conclusions regarding player performance, teamwork, and game outcomes by doing exploratory data analysis, forecasting, and performance evaluation. In this layer, data visualization techniques are also applied in order to show the studied data in a manner that is both visually appealing and instructive.
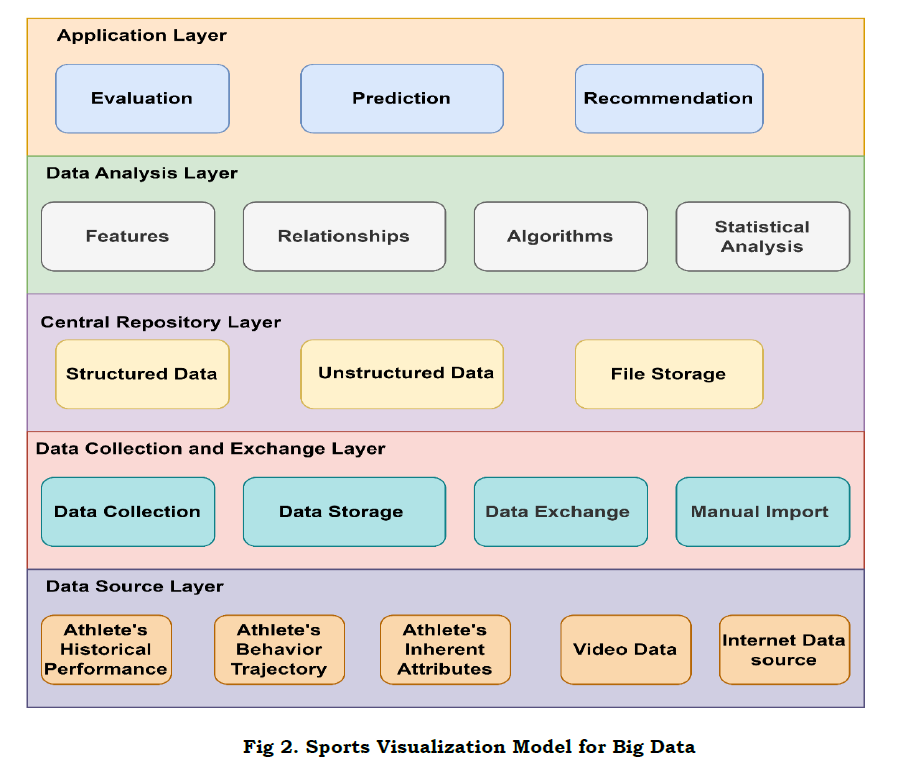
In figure 2, The Central Repository Layer, which includes: A centralized storage and administration system is provided by the Central Repository Layer, which is responsible for keeping the sports data that has been gathered from a variety of organizations.In its capacity as a data warehouse, it stores both structured and unstructured data in a safe manner, thereby guaranteeing the data's integrity, consistency, and accessibility for analysis. Keeping the quality and dependability of the data that is stored is the responsibility of this layer, which makes it easier to integrate data, control data, and implement data security measures.
Data Collections and Exchange Layer: - The Data Collections and Exchange Layer bears the responsibility of gathering information from a wide variety of sources, including sensors, tracking devices, gaming footage, social media, and historical records. Data acquisition, data ingestion, and data transformation are the procedures involved in this process. The goal is to collect raw data and change it into a format that can be used for analysis. This layer makes use of data exchange protocols, application programming interfaces (APIs), and integration tools in order to ease the flow of data between various systems and sources in a smooth manner.
The Data Source Layer: The Data Source Layer is a representation of the numerous sources of sports data that are supplied to the visualization model. Real-time data streams, historical databases, external application programming interfaces, and third-party data sources are all included in this category.The comprehensive dataset that is used for analysis is comprised of a variety of data sources, including player statistics, game logs, sensor data, and social media feeds, among others. This layer is responsible for implementing operations such as data quality checks, data validation, and data cleansing activities in order to guarantee the precision and dependability of the data that is being received. The "Big data-based sports visualization model" is able to leverage the power of big data analytics to improve the visualization, analysis, and decision-making processes in the sports business. This is accomplished by effectively combining these layers.
4. Experimental Analysis and Results
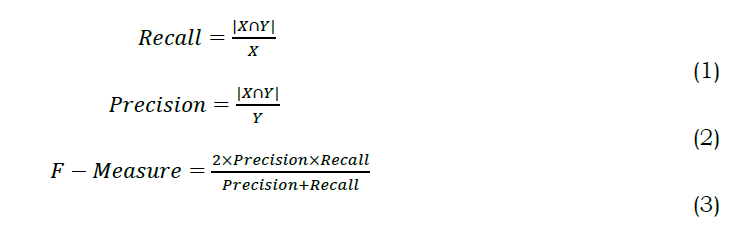
The purpose of the research is to achieve the following objectives: minimize the quantity of data that is processed in real-time; evaluate the effect that learning rate and number of sports data have on the accuracy of the model; and identify the ideal training parameters. The Recall, Precision, and F-Measure are specified in Equation (1), (2), and (3), respectively.
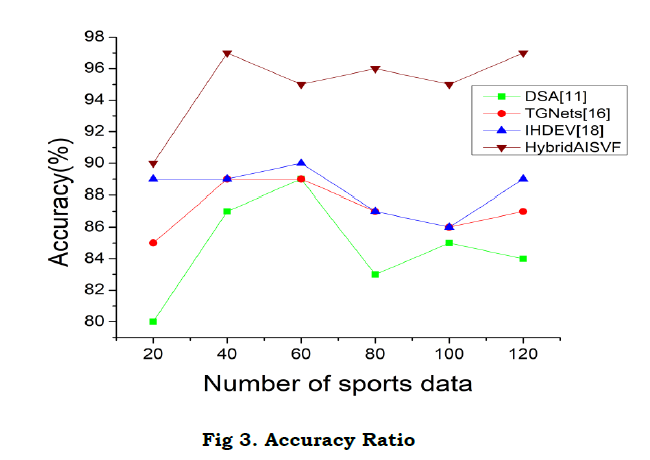
1) Accuracy Ratio
In figure 3, An accurate measurement of the HybridAISVF model's accuracy is the degree to which its predictions correspond with the actual outcomes. This statistic is essential for determining how well the model performs when it comes to processing data pertaining to sports and making decisions based on that information. The optimization of player performance, strategic planning, and decision-making processes can be facilitated by sports teams, coaches, and other stakeholders when they have a high accuracy score.
2) Recall Ratio
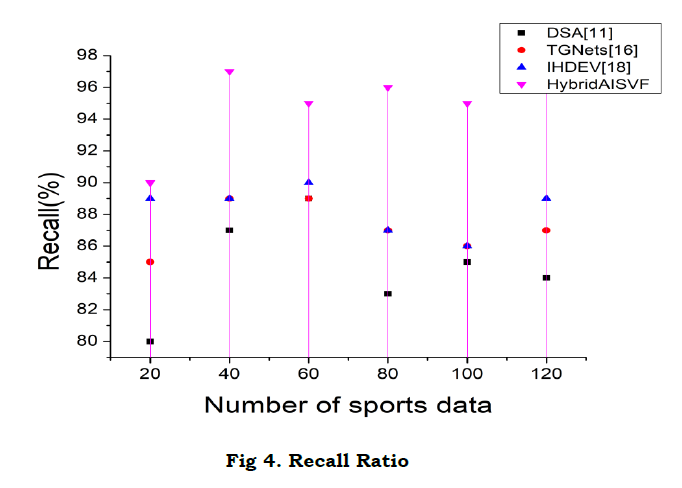
To effectively identify all important instances contained within a dataset, the HybridAISVF model in Figure 4, which is a blend of AI and Big Data Visualization, makes use of recall as a critical metric throughout the process. It is possible to determine whether or not the model is successful in gathering and identifying essential information, such as key performance indicators, player strengths, and strategic insights, by examining the recall score. The importance of this metric cannot be overstated in the field of sports analytics since it guarantees that significant aspects of player performance, team dynamics, and game outcomes are not missed. A high recall rate can provide significant insights and recommendations to sports teams, coaches, and analysts, which enables them to make decisions based on accurate information, optimize player strategies, and improve team performance. When it comes to sports data analysis, having a strong recall metric contributes to a more accurate and thorough analysis, which eventually leads to improved outcomes and competitive advantages in the sports enterprise.
3) Precision Ratio
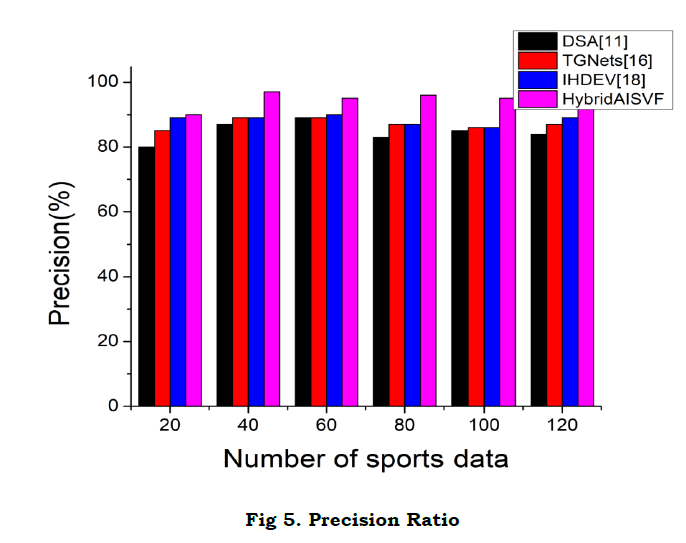
In Figure 5 ,The precision of the predictions made by the HybridAISVF model, which is a combination of AI and Big Data Visualization, is a significant parameter that is used to quantify the accuracy of the prediction model. When the precision score is high, it suggests that the model is reliable in recognizing patterns and trends in the data accumulated from sports. If it comes to making decisions in the sports sector, this statistic is absolutely necessary because it guarantees that the predictions made by the model are reliable and valuable. With a high precision rate, sports teams, coaches, and analysts are able to make judgments based on accurate information, optimize plans, and create increases in performance capabilities. This robust accuracy metric improves the dependability and efficiency of data-driven studies, which in turn boosts competitiveness and success in the ever-changing landscape of the sports industry.
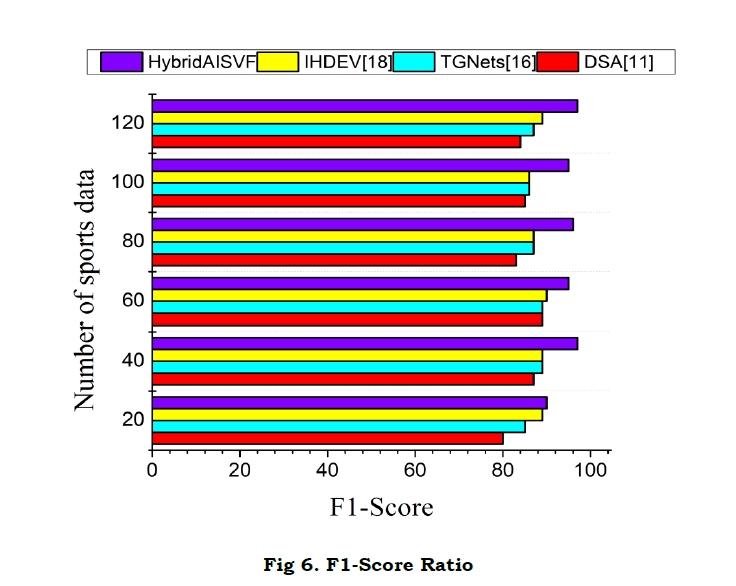
4) F1-Score Ratio
In Figure 6, the context of the HybridAISVF (Hybrid Artificial Intelligence and Big Data Visualization Framework) model, the F1-score is a comprehensive metric that includes both precision and recall to provide a balanced assessment of the model's performance. A single value that takes into consideration both the model's capacity to make accurate positive predictions (precision) and its capacity to capture all relevant occurrences (recall) is provided by the F1-score in the HybridAISVF model. This score is the mean of precision and recall together.A well-rounded performance is shown by a high F1-score in the HybridAISVF model. This denotes that the model is able to attain both high precision and high recall at the same time. Since it ensures that the model can efficiently identify crucial patterns, trends, and insights while simultaneously minimizing the number of false positives and false negatives, this statistic is especially useful in the field of sports data analysis.It is possible for sports teams, coaches, and analysts to harness more reliable and complete insights from the data by optimizing the F1-score in the HybridAISVF model. This can result in informed decision-making, strategic planning, and performance enhancements. Having a high F1-score demonstrates that the model is helpful in providing recommendations that are both accurate and actionable, which eventually leads to improved outcomes and competitive advantages in the market for sports.
5. Conclusion and Future work
The HybridAI Sports Visualization Framework, or HybridAISVF for short, is a revolutionary tool for analyzing and visualizing sports data. In professional team sports, it provides a comprehensive solution for understanding collective tactical behavior, monitoring performance indicators, and limiting risks. This is accomplished through the integration of AI and big data analytics systems. In the sports business, the performance of the framework is superior to that of existing models, which provides stakeholders with important insights, enables informed decision-making, and ultimately optimizes performance. Enhanced feature extraction, real-time analysis, interactive visualization, multi-sport application, sensor data integration, scalability and efficiency, collaborative decision support, longitudinal analysis, interaction with user feedback, and industry acceptance are some of the things that will be done in the future. During live events, the HybridAISVF model intends to include sensor data from wearable devices and tracking technologies, as well as capture more subtle temporal and spatial patterns in sports footage. Additionally, it will provide instantaneous insights for coaches, players, and media commentators. The framework will also be optimized for scalability and efficiency, collaborative decision support will be promoted, performance trends will be monitored over time, and user feedback methods will be incorporated in order to achieve continual improvement. In order to transform sports data analysis and visualization techniques on a smaller scale, it is anticipated that the framework will be embraced by sports organizations, teams, and leagues.
References :
[1]. Du, Meng, and Xiaoru Yuan. "A survey of competitive sports data visualization and visual analysis." Journal of Visualization 24 (2021): 47-67.
[2]. Liu, Aijun, Rajendra Prasad Mahapatra, and A. V. R. Mayuri. "Hybrid design for sports data visualization using AI and big data analytics." Complex & Intelligent Systems 9.3 (2023): 2969-2980.
[3].Torres-Ronda, Lorena, et al. "Tracking systems in team sports: a narrative review of applications of the data and sport specific analysis." Sports Medicine-Open 8.1 (2022): 15.
[4].Corsie, Martn, et al. "Spatial-temporal metrics to assess collective behavior in football: a systematic review and assessment of research quality and applicability." Journal of athletic enhancement 10.8 (2021).
[5]. Pu, Zhiqiang, et al. "Orientation and decision-making for soccer based on sports analytics and AI: A systematic review." IEEE/CAA Journal of Automatica Sinica 11.1 (2024): 37-57.
[6]. Ángeles Rojas, Jorge Alexander, et al. "Hybrid model of convolutional neural network and support vector machine to classify basal cell carcinoma." Computación y Sistemas 25.1 (2021): 83-95.
[7]. Bai, Zhongbo, and Xiaomei Bai. "Sports big data: management, analysis, applications, and challenges." Complexity 2021 (2021): 1-11.
[8]. Cossich, Victor RA, et al. "Technological Breakthroughs in Sport: Current Practice and Future Potential of Artificial Intelligence, Virtual Reality, Augmented Reality, and Modern Data Visualization in Performance Analysis." Applied Sciences 13.23 (2023): 12965.
[9]. Ghosh, Indrajeet, et al. "Sports analytics review: Artificial intelligence applications, emerging technologies, and algorithmic perspective." Wiley Interdisciplinary Reviews: Data Mining and Knowledge Discovery 13.5 (2023): e1496.
[10]. Agarwal, Shilpi. "Artificial Intelligence in Sports Industry." Artificial Intelligence for Business. Productivity Press, 2023. 250-269.
[11]. D’Urso, Pierpaolo, Livia De Giovanni, and Tim Swartz. "Big data and data science in sport." Annals of Operations Research 325.1 (2023): 1-7.
[12]. Afzal, Shehzad, et al. "Visualization and visual analytics approaches for image and video datasets: A survey." ACM Transactions on Interactive Intelligent Systems 13.1 (2023): 1-41.
[13]. Mohapatra, Srikanta Kumar, et al. "Game Data Visualization Using Artificial Intelligence Techniques." Proceedings of International Conference on Recent Trends in Computing: ICRTC 2022. Singapore: Springer Nature Singapore, 2023.
[14]. Baumer, Benjamin S., Gregory J. Matthews, and Quang Nguyen. "Big ideas in sports analytics and statistical tools for their investigation." Wiley Interdisciplinary Reviews: Computational Statistics 15.6 (2023): e1612.
[15]. Agarwal, Shilpi. "Artificial Intelligence in Sports Industry." Artificial Intelligence for Business. Productivity Press, 2023. 250-269.
[16]. Raabe, Dominik, Reinhard Nabben, and Daniel Memmert. "Graph representations for the analysis of multi-agent spatiotemporal sports data." Applied Intelligence 53.4 (2023): 3783-3803.
[17]. Shorman, Samer, Muath Jarrah, and Ahmed R. Alsayed. "The websites technology for Arabic language learning through COVID-19 pandemic." Future of Organizations and Work After the 4th Industrial Revolution: The Role of Artificial Intelligence, Big Data, Automation, and Robotics. Cham: Springer International Publishing, 2022. 327-340.
[18].Liu, Hao, et al. "Health care data analysis and visualization using interactive data exploration for sportsperson." Science China Information Sciences 65.6 (2022): 162101.
[19]. Li, Wenya, C. Karthik, and M. Rajalakshmi. "Big data visualization for in-situ data exploration for sportsperson." Computers and Electrical Engineering 99 (2022): 107829.