An Analytical Model of Variant Data for Asynchronous Wearable Sensor Data Streams
Authors :
Kumar Mohan, Mohamed Kuresh Safir, and Rajesh Natarajan
Address :
University of Technology and Applied Sciences, Sultanate of Oman
Abstract :
Wearable sensors (WS), depending on where they are placed and what they are used for, transmit data at regular or irregular intervals. Accurate and consistent analytics require handling each asynchronous data stream separately. This provides dependable responses and solutions for diagnosis and prophylactic measures. In order to handle asynchronous data streams, a Variant Data Analytical Model (VDAM) is presented in this study. In this theory, data analysis takes into account changes in the size, sources, and priority of the data stream. For priority-based variation analysis, a standard prediction classifier is employed to separate variants from consistent data streams. The probability instances of the classifier are trained using these segregated and non-segregated instances. As a result, the classifier produces balanced, parallel, latency-controlled analytics of the input stream. Additionally, the analytical model may be easily adjusted to accommodate data streams derived from WS sources, thereby decreasing pipelined processing errors. Based on the classifier output, a response or set of recommendations for the diagnosis is given, limiting the high processing rate.
Keywords :
Data Analytics, Parallel Processing, Prediction Classifier, Wearable Sensors.
1.Introduction
Wearable Sensor (WS) technology is designed for providing personalized and handy healthcare services for humans. WS technology permits tiny sensors to be fabricated in wardrobes or implanted in human body for periodic observation [1]. Factors such as temperature, humidity, pulse rate, etc. are sensed as vital signals and are communicated for clinical diagnosis. The tiny size of the sensors makes it more invisible that it can be implanted anywhere in the human body [2]. Wearable rings, smart watches, head bands are some of the real-time WS devices. Being tiny, they are affordable for sensing and transmission through radio units; computation is complex due to the size of the sensors. Therefore, the WS are interfaced with mobile devices for global communication [3]. In this communication, heterogeneous platforms such as the Internet of Things (IoT), cloud, etc. are interconnected for ease of information sharing and computation support. Wearable sensor technology relies on short-range communication to interoperable communication standards for pervasive resource access and intelligent processing. WS signals are handled as data for analyzing its features and extracting useful information. The intelligent computing and decision-making paradigms are exploited for handling healthcare data. A computation and communication assisted IoT architecture leverages the performance of smart healthcare systems using WS [4, 5].
WS data analytics requires intense processing and classification features aiding heterogeneous data management. The WS data are either light-weighted or fused streams that require different computing methods [6]. In the classification process, the continuity and discreteness of the data is to be identified for mitigating uncertainties and variations. The unattended variations impact over the analytics output resulting in false predictions and delay [7]. The data exchange between the WS and the computing platform also experiences transmission issues due to interrupts and prolonged wait times. These issues are to be addressed by assigning appropriate resources and offloading strategies in pervasive healthcare scenarios [8]. The prime function is the data classification for its features and stream analysis. IoT platform offers differential computation schemes through artificial intelligence and machine learning endorsements. These features are utilized for WS data analysis in different healthcare applications, for reliable services. Therefore, intelligent analysis and processing of WS data is performed using machine learning techniques for better accuracy [9, 10].
Machine learning techniques are incorporated in WS data analysis as they provide ease of classification in achieving high accuracy. The learning paradigms are trained from the occurring instances that identify the data condition and provide better recommendations [11]. In the training and assessment process, external and internal datasets are incorporated for tuning the machines. In WS data analytics, the fore-mentioned classification, deviation identification, etc. are identified through recurrent processing [12]. Based on the classification, the consistency and uncertainties in data management are identified. Therefore, the error and accuracy classes are identified at early stages preventing data losses and validation inconsistency [13]. WS applications rely on different computing paradigms for reducing the errors in data processing, and classification [14]. The recommendations provided by the applications depend on learning outputs for sophisticated assistance. Novel learning paradigms are mandatory for handling volume-based and light-weight WS data streams and regardless of time and frequency factors. The influence of machine learning and artificial intelligence improves the accuracy of processing and application support [15, 16].
2. Related works
Arora et al. [17] presented a WS data analysis method for sleep quality estimation. This method relies on a convolution neural network and multilayer perceptron for handling different data inputs. The imbalance in data analysis is mitigated using oversampling technique augmenting different instances. This joint method improves the accuracy of quality estimation, reducing loss.
In [18], the authors exploited wearable technology data for forecasting sports injuries. The sensor devices are used for observing body mass index and mechanical load for predicting injuries. In this forecasting method, the data features associated at different time intervals are identified and analyzed to improve precision. The quantified data are acquired using Zephyr BioHarness sensor technology.
Unsynchronized Sensor Data Analytics (USDA) is proposed by Alfarraj and Tolba [19] for time-dependent and non-dependent sensor input management. The observed data is classified using time and frequency for predicting the missing sequences. Such estimation improves responsive and non-latent solutions based on data analysis. This analysis method handles the error due to time and frequency changes, improving the efficiency score and reducing time complexity.
Maman et al. [20] introduced a reliable data analysis framework for fatigue management using WS data. The fatigue is managed in four different steps, namely detection, identification, diagnosis, and recovery. Machine learning and fatigue features are recurrently analyzed and updated for knowledge-based diagnosis. This framework achieves high consistency and accuracy in different real-time experimental scenarios.
Uddin [21] assimilated WS technology and edge computing for designing a smart healthcare system. This system focuses on activity recognition by observing WS data and analyzing it using a recurrent neural network. The learning network is trained using the data features that are extracted from the observed input. The proposed system achieves high performance as assessed using an accuracy and confusion matrix.
Edge-Stream based Computing Architecture (ESCA) is proposed by Greco et al. [22] for real-time WS data handling. This architecture is designed using IoT and big data paradigms that operate in different healthcare systems layers. The pre-processing and sensing layers of the IoT paradigm in medical healthcare are exploited for reducing anomalies and data loss.
Fouad et al. [23] projected distributed and scalable computing framework (DSCF) for reliable communication assistance in IoT-based WS. This framework focuses on resource allocation and satisfying the user requirements. By adopting the pervasive computing features, the data exchange rate and latency are optimized. The advantage of the framework is its dynamic support for the end-users in managing storages and reducing backlogs.
Fuzzy decision-making (FDM) is employed for optimal decision-making using WS data in [24]. The sports activity data is analyzed for decision-making in assisting rehabilitation and injury detection. The aggregated data is first classified for leveraging the analysis accuracy. The data analytics method exploits the independent fuzzy functions for processing varying inputs. The proposed decision-making method achieves high accuracy and less decision time.
Mahmud et al. [25] introduced a multi-stage training approach for human action recognition using WS data. The time-series data is by extracting its features for identifying different transformations. The raw data is trained and validated using a convolutional neural network for improving accuracy. In this process, the features from different solution spaces are identified and trained to prevent loss and complexity.
Zhou et al. [26] proposed an improved Bayesian convolution network for improving the accuracy of human activity recognition using WS data. This network is employed in IoT-based WS architecture for heterogeneous data processing. The data features are extracted using latent variables and assessed using enhanced deep learning. As this method supports offloading, the uncertainty in data processing is reduced.
For improving the reliability of data exchange in WS-healthcare applications, Alsiddiky et al. [27] designed a priority-based data transmission method. In this method, selective decision based on data characteristics is adopted for preventing congestion and queuing delay. The data exchange is balanced based on the priority and availability to improve the delivery rate and reduce latency.
Li et al. [28] proposed a hybrid human activity recognition model by integrating WS and remote sensing data. The assimilated data stream is huge and is processed using incremental fast learning. The data is classified as spatial and kinetic for basic and extended movement identification. In this process, the proposed learning inherits the swarm intelligence for data feature selection and accuracy improvements.
A proactive falling risk assessment mechanism is proposed and discussed in [29] using observed WS data. The data concerning muscle fatigue from body area networks are used for predicting the falling risk. This real-time processing relies on android application and hardware combination for fatigue analysis. The limb activity-based functions and assessment shows the reliability of the proposed mechanism.
Large data streams impact the flow control procedures in smart healthcare applications. Gai et al. [30] created a self-powered wearable sweat analysis system that can continuously monitor molecular-level biomarkers without the need for wires or batteries. The system transforms mechanical energy into electricity employing miniature sweat sensors and hybrid nanogenerator modules. The technology provides helpful health information through real-time, on-body sodium and potassium biomarkers detection.
3. Variant Data Analytical Model
The data stream is transmitted to the WS at different time intervals and deploys consistent analytics and accuracy. Here, the synchronize and asynchronous data is differentiated to provide access as the response to the initial node. The initial node requests the data in WS, and in turn, the response is forwarded to the WS node. In this work, VDAM is used to handle the asynchronous data stream. Here, the data stream size, sources, and priority are considered for the analytic data model by deploying the proposed model. A formal representation of the proposed model is presented in Fig. 1
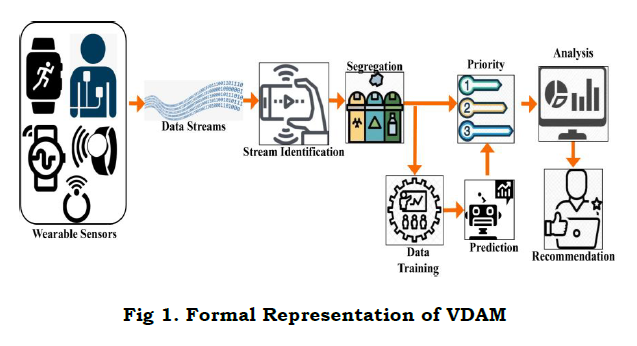
. The WS data streams are identified for different instances that segregate the priority and training data. The prioritized data is used for analysis followed by the recommendation. The training data is used for predicting different new prioritized data. This process is bypassed for further recommendations.
a. Wearable sensor data analytics
The data analytic is used to handle the asynchronous data stream by differentiating the analytic data model. Here, the priority-based classification is estimated for the reliable response forwarding to the nodes in the network. In this processing step, access is provided for the diagnosis and preventive remedies. The conventional prediction classification is used for the priority-based variation analysis. For this processing, a determination is done for the regular and unpredictable time interval is carried out and is equated in the below equation.

The determination is done for the regular and unpredictable time interval that deploys the WS transmit to diagnose the data stream in the network. Here, the synchronize and asynchronous data is determined by deploying the request and response that is examined for the different time intervals. In this processing step, the priority-based data stream is used for the reliable response and solution that is used to diagnose and preventive remedies. The evaluation is done to diagnose the data stream in WS and derives the regular flow of data that responds to the node. This computation method is used to examine the failure data in the WS and avoids further processing in the network.
The examination of the data stream without the asynchronous is differentiated for better detecting un-reliable response to the data transmission. The regular and unpredictable time interval is used to determine the better detection of the data stream. The reliable request and response are made for the better detection of the data stream. In this processing step, synchronous and asynchronous data is differentiated by evaluating the diagnosis and preventive remedies. The determination is used to find the data stream, and it is represented as D, data and number of data is denoted as ad and an. The diagnosis is made for the data stream in WS, and it is termed as g′, and data is handled for the appropriate processing, and it is denoted as h0.
The data forwarding/transmission is referred to as im, the regular and unpredictable data is termed as re and ud. The request and response of data handling is represented as es and oe. The initial node requests the data to the neighboring node, and it is referred to as pt and bt, the time of processing is represented as i′. The data stream is used to transmit the data to the requested node, and it is termed as s0. The regular and unpredictable data is used for the data stream, and it is represented as (re+udΣs0es). The below equation is used to differentiate synchronize and asynchronous data stream in WS and deploys the request and response to the initial node.

The differentiation is done for the synchronization, and a synchronized data stream is done for efficient transmission. The regular and unpredictable data transmission and determine the variation analysis that deploys the priority-based. The data is used to evaluate the better detection process and examine the diagnosis of data. In WS, the synchronization and a-synchronization data are differentiated in the above equation (1b), the first derivation represents the synchronization and the second derivation indicates synchronization data. Here, the request and response are forwarded by determining the recommendation system.
The recommendation is made to differentiate synchronization and asynchronization of data in WS and evaluate the better transmission. Here, the differentiation is denoted as F; in this case, a neighboring node is used to evaluate the request and response of data transmission. In this case, diagnosis is used to evaluate the transmission by deploying priority-based processing. Thus, the differentiation is derived from the previous step of processing and examines the data forwarding. The synchronization is done if related information is detected whereas, a-synchronization refers to the non-related information of the data stream, and it is denoted as S and A. The following equation is used to examine the request and response to diagnose the data stream
The request and response are used to diagnose the data stream and deploy the reliable output that indicates preventive remedies. In this computation step, the variation is used to derive the data from the service provider in WS, and it is requested from the initial node. Here, the neighboring node indicates retrieving the necessary information from the requestor. Thus, the request and response are detected for the number of requests handled by the WS. The reliable response and solution are used to diagnose and preventive remedies of data variations, and it is represented as vr. Thus, the diagnosis is derived in this above equation that deploys the data variation for the data stream and examines the initial node, and it is represented as (iman⁄h0)+pt(im).
This variation of data is derived and shows the time-based extraction and forwards the response to the neighboring node. Here, the neighboring node processing is derived, indicating the request from the node is processed and forwards the response. This transmission is done for the relevant data extraction from the WS, and it deploys the relevant extraction, and it is denoted as z′. The examination of request and response is done to diagnosis the data stream, and it is represented as X. In this synchronization and a-synchronization is evaluated for detecting various data that includes the data stream size, source, and priority is examined in the below section.
b. DataStream Variation and Identification
The data stream differs based on the size, source, and priority; from this, the communication is established between the requestor and WS. In this case, size is estimated for reliable processing, which deploys the reliable response/solution used to diagnose preventive remedies done from the VDAM. This approach evaluates the variation in the data stream and provides the necessary information to the requestor. The time-based processing is carried out by determining the variation in data size, and from sources that define the nodes and priority is done based on the processing. The data stream variation is evaluated in the below equation as follows.

The analysis is done for the data stream that deploys to transmit the regular and synchronized data to the neighboring node. Here, data is handled by determining the priority-based processing that forwards the request to the responder. The diagnosis is evaluated from the reliable response, and the solution is provided efficiently. The synchronization is detected in this approach and estimates the variation of the data stream. Here, the detection is done to avoid the failure of data processing, and it is referred to as K. The analysis is done for the synchronized data and responds on time, and it is defined as Y. The data stream variation and its identification is portrayed in Fig. 2.
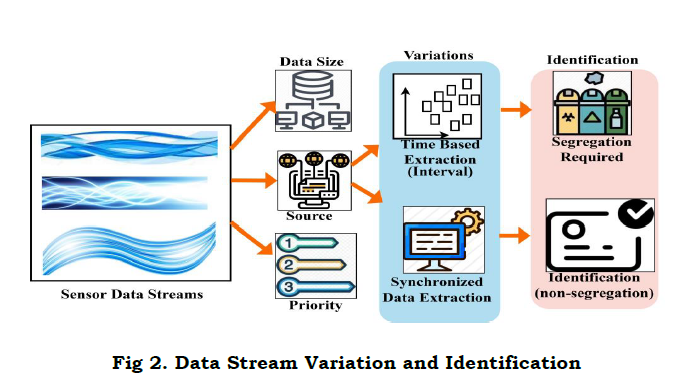
The analysis of data stream size varies for every step of iteration in the WS; for deriving this evaluation, better detection is done for the data. Here, the diagnosis is made by determining data validation from WS as the request and transmitting the relevant data to the neighboring node. The neighboring node is responsible for examining the priority of data extracted and forwards the services. Based on the size, source, and priority, the data is transmitted to the requested node in WS. Thus, the differentiation is evaluated for the better detection of synchronization of the data stream. The data stream is identified by using a Conventional prediction classifier.
c. Conventional Prediction Classifier
The classifier model categorizes the segregation and non-segregation data stream and provides reliable processing that improves the accuracy. In this evaluation step, latency is decreased by improving the accuracy level, which deploys the prediction-based classification. Here, the conventional prediction is made for the requested node in WS. The scope of using this classifier is to prioritize the variation data and determine the segregation analysis. The below equation is used to identify the data stream and improves the accuracy level.

The data stream is identified by equating the above equation; thus, the accuracy level is enhanced based on the priority-based data variation. In this approach, the neighboring node's data stream identification is responsible for transmitting the data to the data provider in-network. Here, synchronized data is forwarded to the neighboring node, and it is computed as (bt(im)S(es)⁄). This data stream is identified for better communication and information exchange between the initial and neighboring nodes. In this case, detection is done by deploying the variation associated with the synchronized data. Fig. 3 presents the prediction classifier process in the segregation process.
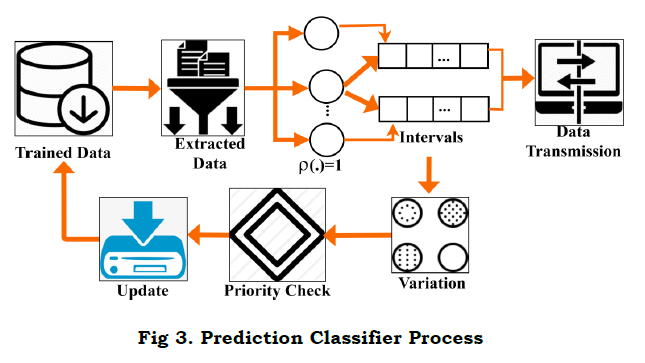
The synchronized data is forwarded to the responder node that employs the priority-based data variations. The strategy is examined in this process is done by introducing the VDAM method. The detection of neighboring node data variation is done for efficient transmission, and it is represented as [bt(i′)+K]∗vr(ad). The derivation is evaluated for identifying the data stream by detecting the priority-related data in WS, and it is denoted as I. Thus, the identification of the data stream is examined and shows reliable accuracy in the proposed work. The segregation and non-segregation data is done by deriving the following equation (4b).
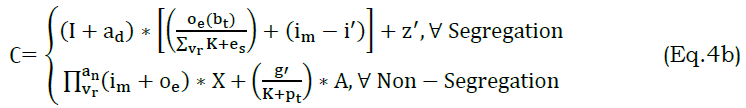
The classification is done for the segregation and non-segregation of data for better streaming. The WS relevance aids synchronized transmissions. The synchronization transmission is examined by equating equation (1b). here, the segregated data employed the relevant information extraction and forwarded to the neighboring node. In this evaluation, data detection is done as the request and transmit to the other node by collecting the relevant data. Post to this collection of relevant data, the forwarding is done for the numbers of requests.
The classification is done for the number of data requests from the user. It is denoted as ∁ in this the identification is made for the data streaming., here, it deploys the segregated data that indicates the synchronized data sharing to nodes in WS. The computation is done with two derivations; the first indicates the segregation of data that deploys the relevant information gaining whereas, the second represents the non-segregation. The non-segregation is done for the non-relevant information gathering. Thus, the classification is done for the varying data stream and employs the better priority-based data variation. The above equation satisfies the segregation of relevant information that employs the VDAM and priority-based variation analysis. From this derivation, the training data is evaluated by equating the below equation (5).
The examination of data and streaming is done by performing a priority-based classification method that includes data segregation. The segregation data diagnosis the relevant information extraction and transmit appropriately. Here, the differentiation of synchronization and asynchronous is done for the better detection of the data stream. The diagnosis is made by evaluating the better analysis of data variation, and that deploys the prediction. The prediction is done from the preceding step of processing and retrieves the necessary information from the previous node. Thus, the examination of data and streaming is diagnosed to improve the training data by performing prediction. The segregation and non-segregation are represented as G and R
The diagnosis is derived from this method, and it indicates the regular and unpredictable data on different intervals. The analysis is done for the data streaming process and deploys the conventional prediction classification concerning the VDAM method. In this case, the relevant information is extracted from the diagnosis state and provides the synchronized transmission. From this, synchronization of data is derived and shows the differentiation of transmission on mentioned time. Thus, the examination is done for better training data and deploys the prediction process that maps the preceding state of action. The following equation is used to transmit the data streaming that is segregated in a synchronized manner.

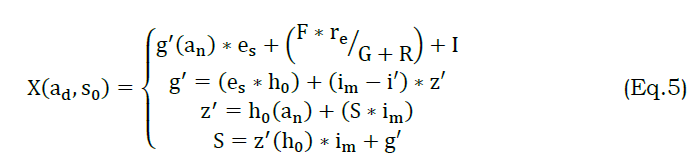
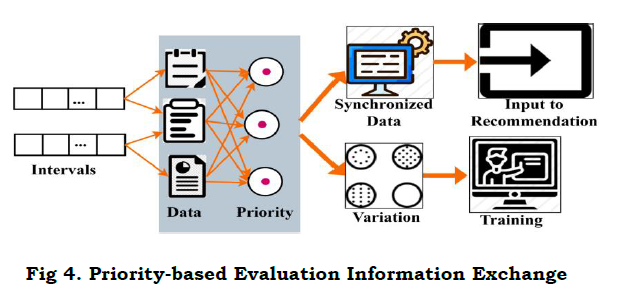
The data variation is done by determining the synchronized data that deploys priority-based processing and ensures accuracy. This processing relates to extracting the necessary features from the data and employs the training data set. The training data is improved by proposing a conventional prediction classification used for the segregation of data. The data segregation is done by determining the efficient variation of data and deploys the priority-based classification, and it is termed as y′. The priority is done with the data stream size, source and based on this, and the processing is evaluated. The priority-based evaluation for training is presented in Fig. 4.
The evaluation step is used for the synchronized data and transmit the relevant information on time. In this process, the detection is done for the synchronized data stream based on priority computed as [s0(S)+(y′∗adC)]. The data variation is done by evaluating the better data streaming and deploys the training data, and it is denoted as na. The training data is used to determine the data stream size, source, and priority. The training data is improved in this method by performing prediction with the previous state and provides the resultant. The following equation is used to find the probabilistic for the training instances that are performed post to the classification.

The probabilistic method is used for the training instances in the proposed work for the better classification of the data stream. In this category, the detection is done to detect the data stream better and transmit the response. The initial node is responsible for forwarding the synchronized data to the requestor. In this stage, the identification is examined for the conventional prediction classification. This is estimated by performing a priority-based classification. The data stream is prioritized and determines whether the diagnosis is made correctly or the training instances are extracted reliably. Based on these two cases, the probability is examined for the number of data related to improving the accuracy level. This processing is done for the training data, and that deploys the synchronized forwarding. Table 1 presents the failure post different training instances of different requests.
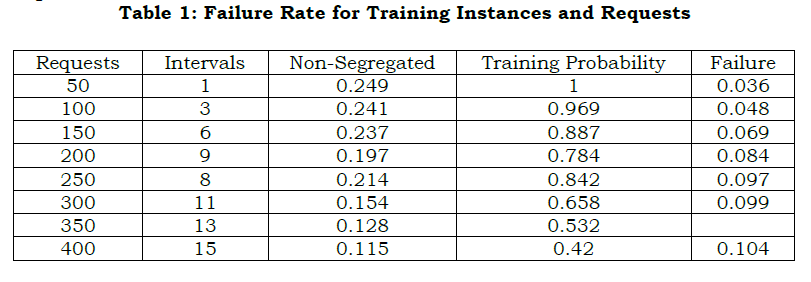
The different request is handled by the node on the time interval and shows higher processing. If the varying interval increases, then the non-segregated data shows better enhancement. If non-segregated shows better processing, the training probability also increases, whereas failure is decreased (Table 1).
The segregated data is used to evaluate the better training phase associated with the prediction process. The prediction is carried out by evaluating the better analysis of data streaming and forwards the appropriate data. In this case, request and response are determined for the probabilistic method and provides the relevant information exchange. The following equation is used to analyze the priority-based variations.

The priority-based prediction classification is done on the above equation, which is used to segregate the relevant information and transmit it to the neighboring node. In this case, priority is done from the prediction process that estimates the mapping with the previous state and provides the resultant. The resultant is done by determining the relevant information forwarding to the node. The prediction is performed for every step of the priority-based analysis, and it is denoted as ℙ. The prediction is performed for the relevant information extraction from the preceding data, and this priority is examined. The priority is examined for the data stream size and determine the better detection of a training set of data.
In this case, segregation is done to synchronize data to the appropriate node in the network. Here, the differentiation of synchronizing and asynchronous is done for the reliable transmission of regular and predictable data. For ensuring predictable data streaming, this priority-based classification is introduced and executed along with the VDAM method. Thus, the priority-based processing is done for the segregated data and deploys the conventional prediction classifier. The following equation is used to determine the recommendation system for the diagnosis of data post to the classification method to improve the processing rate.
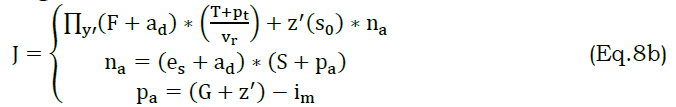
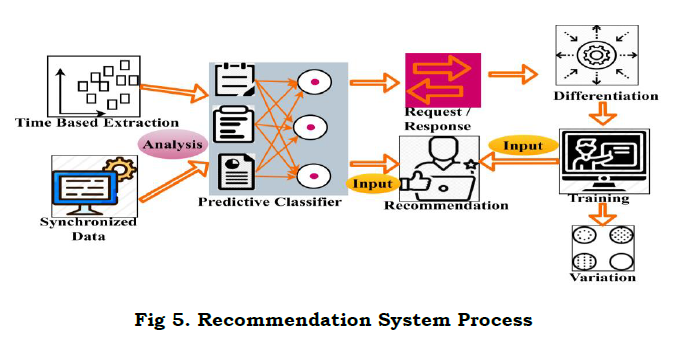
The recommendation system is used to provide the relative information and deploys better identification. Here, the recommendation is done for the relevant information from the WS and detects the priority-based variation analysis. The segregation is done for the synchronized data and deploys the training dataset. The recommendation system process is illustrated in Fig. 5.
The training dataset is used to transmit the relevant information and deploys the segregation data. The predictable data stream is done on the different intervals and determines the different time intervals. The recommendation system is done by mapping the preceding dataset, and it is represented as J. The relative information is extracted by performs mapping, and it is denoted as pa. The following equation is used to estimate the prediction.
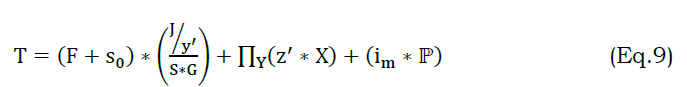
The prediction is estimated for the requests from the initial node and forwards to the neighboring WS. The prediction is performed by mapping the preceding state and providing relevant information on time. Here, the transmission is examined for the differentiated data stream and indicates the recommendation system. The recommendation is done for the probabilistic method and estimates the data streaming, and it is represented as T. The segregation is done on the WS by evaluating the synchronized data. The data stream is done by deploying the synchronized data from the initial node and forwards to the requestor. From this, failure is decreased by computing the below equation as follows.

In the above equation (10), detection is performed by determining the synchronized data. Here, the request is handled by the node and determines the cooperative prediction classifier. This is performed by deploying the VDAM method and finds the predictive and regular data streaming. The segregated data is forwarded to the neighboring node at the mentioned time. The probabilistic method is used to indicate whether the data is segregated or not. In the above equation, failure is addressed and decreased by performing prediction, and it is referred to as lu. Here, a recommendation system is used to diagnose the classifier output and show a higher processing rate that satisfies the objective. This paper addresses the issues by introducing a cooperative prediction classifier along with the VDAM method.
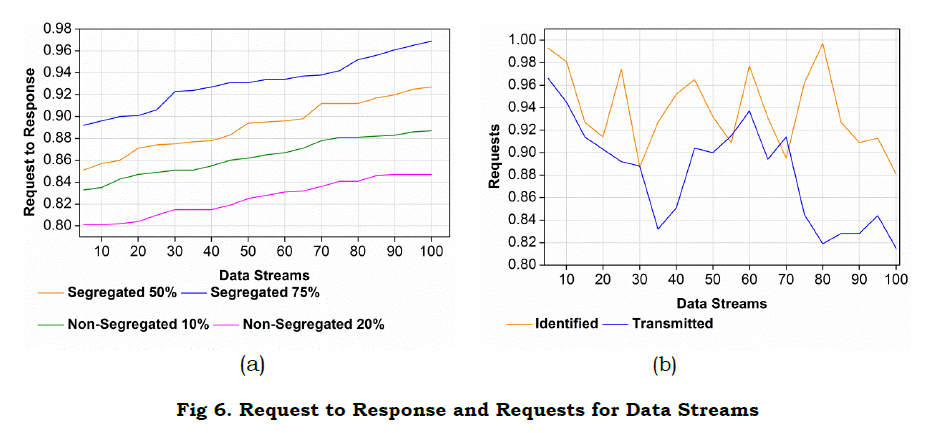
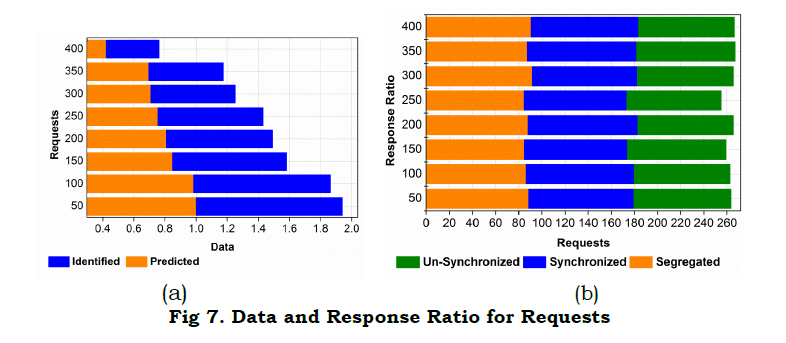
The data stream is examined for the different states of request and response that deploy segregation and non-segregation. The segregated data is used to determine the better request and response handling whereas, non-segregated shows a lesser handling ratio. If the data stream increases then, the segregated data shows better processing. The data stream is estimated for the various request from the WS node and forwards the response to the neighboring node. In this streaming identification and data, transmission is carried out by decreasing the failure. Here, it shows a higher data stream whereas, the transmission and identification also increase. Thus, the request is improved if the data stream is enhanced (Fig. 6).
The different nodes handle the request in WS, and it derives the prediction for the identification of the data stream. The data stream is done by differentiating the synchronized and non-synchronized data based on the prediction that deploys the identification. If the prediction increases, then the request handling also enhanced and showed better identification. The request and response are forwarded to the appropriate node that deploys synchronized and asynchronous and segregated and non-segregated data. Compare to segregated and unsynchronous data, and synchronized data shows better requests and responses. In another case, if the request and response increase, the synchronized data also improved (Fig. 7).
4. Results and Discussion
This section briefs the performance of the proposed model using experimental validations. The dataset from [31] containing real-world human activity recognition inputs is used in the validation process. This dataset contains information of 8 activities from 15 subjects observed between 5 and 10min time intervals. The data is fused into a single entity based on the time of arrival feature for 100 counts. In this model, 22 user equipment generates 400 requests observed in 120min for fetching the analyzed information. A comparative analysis is performed for validating the performance of the proposed model using processing rate, latency, response ratio, transmission failure, and variation. In this analysis, the methods ESCA [22], DSCF [23], and USDA [19] are accounted.
a. Processing Rate
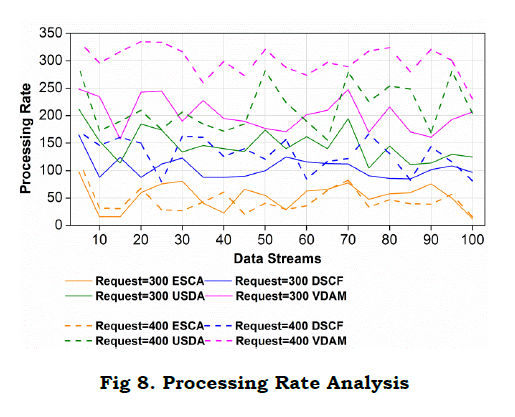
The processing rate for the proposed work is high in comparison with the existing three methods (Fig. 8). This is achieved for varying data streams by forwarding the data to the appropriate responder. Here, the prediction is carried out for synchronized data transfer by deploying unpredictable and regular data. The data stream is used to determine the priority-based variation analysis, and it is evaluated as Π(im+Sg′)ad. This data is requested to the WS, and the response is forwarded to the neighboring node. Here, synchronized and asynchronous is differentiated to stream the data in WS. In this processing, the rate is improved by deploying the prediction that performs matching with the preceding state and provides the resultant. Here, the training data is used to determine the recommendation for the process. The recommendation system is developed to perform better segregation of data. In this step, the unpredictable time interval is addressed by deploying asynchronous transfer. Here, a conventional prediction classifier is used to differentiate the segregated and non-segregated data. The segregated data is used to evaluate the probabilistic instance that includes the training dataset, and it is represented as (Πbt(h0)+s0esadKre⁄). The detection is done for the segregated data and improves the processing rate.
b. Latency
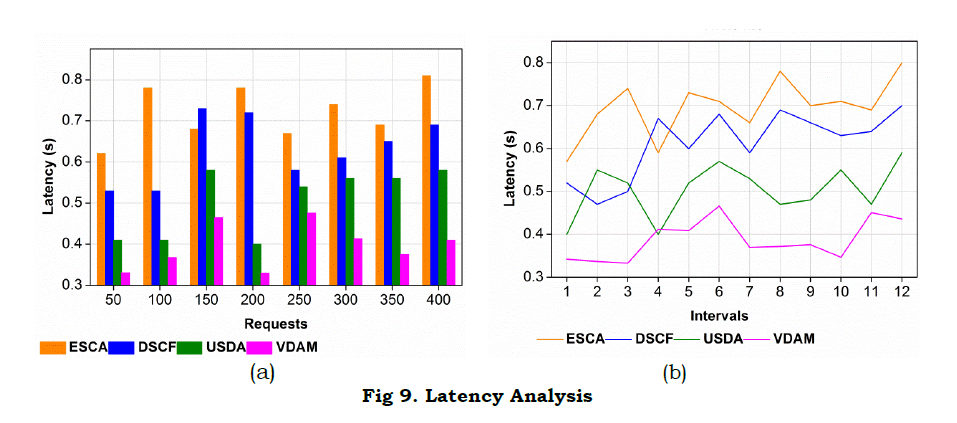
In Fig. 9, latency decreases for varying request and time intervals, deploying the segregated data transmission. The relevant information is shared to the appropriate node in WS, and that estimates the neighboring node. In this computation step, the data handling is done for the data stream, and it relates to the training data, and it is represented as [(oe(bt)ΣK+esvr)+(im−i′)]. Here, the request is handled by the recommendation system, and that determines the asynchronous data transfer. In this case, prediction is made for every step of iteration that deploys the priority-based variation analysis. This is done for the segregated variation of data and reliably performs the prediction. Here, the regular and unpredictable time interval is estimated by deriving the segregated and non-segregated data streaming. In this case, relative information is shared to the requested node, and mapping is carried out. The mapping is done with the preceding state and estimates the relevant information. The information extraction is done for varying intervals, and it evaluates the better detection of data loss. The priority-based variation is examined for the data handling, and it is associated with the classification method. The classification is done for the different data streaming, which deploys the prediction for the number of requests.
c. Response Ratio
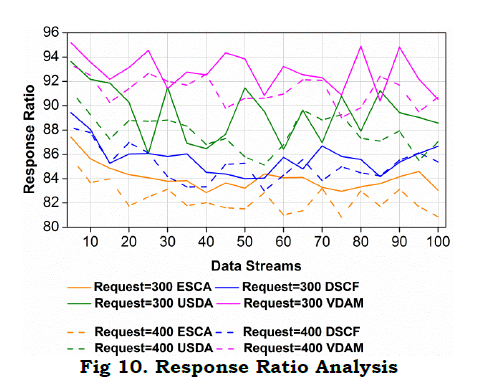
The response ratio concerning the data stream is examined for efficient processing. Here, the response is forwarded to the requested node in WS. Here, the initial node forwards the information to the management system; from this data is provided as the response to the neighboring node. In this case, the request is handled by evaluating the training data and deploys the segregated data. The segregated data is used to determine the synchronized transmission, and it is evaluated as (F∗reG+R⁄). The non-segregated data is avoided in the WS network and derives the synchronized transmission. Here, the prediction is carried out by evaluating the better detection of data and provides the probabilistic method. In this case, identification is carried out for the different requests and responses handled associated with the neighboring node. The neighboring node is used to relate with the training data and maps the processing. The evaluation is examined for the different handling of the data stream and estimates the synchronized transmission. The time is calculated for the various data stream and determine the training data. The training data is estimated from the prediction method and responds on time. By performing this method, the response ratio shows better processing in the mentioned time (Fig. 10).
d. Transmission Failure
The transmission failure is evaluated for detecting information loss in WS and is avoided by proposing priority-based variations. The priority is carried out by deploying the synchronized data transmission. Here, the data stream is done by mapping the previous state and provides the result for the requested node, and it is evaluated as (IΣ(im+S)ads0).
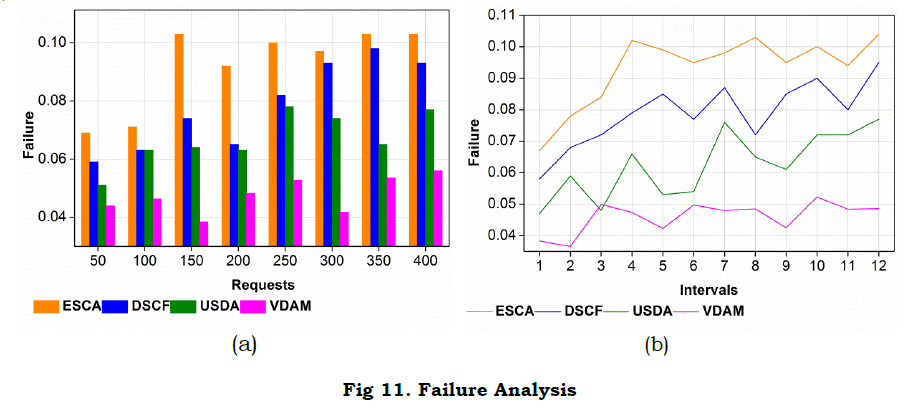
The synchronized transmission is done to avoids failure. If the failure is addressed then, the segregated data is forwarded to the appropriate node. This process includes the different states of the data streaming and that deploys the recommendation system. The recommendation system is used to relate with the existing data and provides the related information retrieval. The relevant information is forwarded to the requested node, and that derives the probabilistic method. The probability is used to define either the data stream is done appropriately or not. For defining this, the diagnosis of a node in the WS is examined by evaluating the prediction method. The mapping of previous data with the current data provides the relevant extraction. The segregated data is evaluated for the training data and examines the failure on time. The segregated data is forwarded to the responder at the mentioned time associated with the recommendation system (Fig. 11).
e. Variation
In Fig. 12, variation for the proposed work decreases by comparing with the existing three methods for varying request and interval. Here, it states the segregated data transmission to the responder in WS. In this case, the synchronized transmission is done for the better mapping that deploys the recommendation system. The recommendation system is done for the appropriate detection of streaming. The analysis is done a post to the failure identification in the network, based on this streaming is carried out computed as (T+ptvr)+z′(s0)∗na. The priority-based variation is done for the different time intervals.
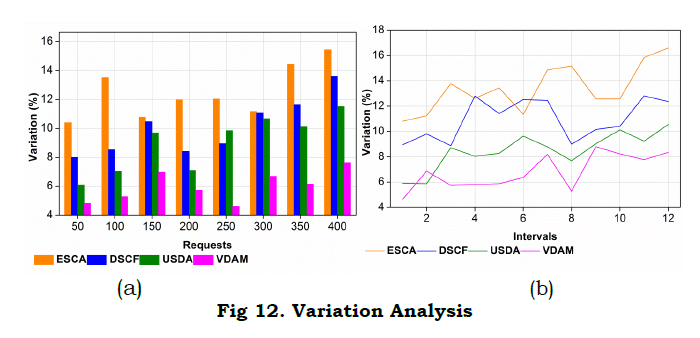
In this case, predictable and regular data is detected and forwards to the appropriate node. Here, the segregation is done from the better recommendation system. The recommendation is made for the different request that is handled by the requestor. Here, the mapping is done efficiently, and determine the synchronized transmission that evaluates the priority. The priority is done based on the prediction; if the relevant data is extracted then, the variation occurs; in another case, there is no variation. So, based on the prediction and priority-based variation data stream is examined. The evaluation is done for a better classification process. Here, segregated data is used to evaluate the conventional prediction classifier and shows lesser variation. The comparative analysis results are presented in Tables 2, 3, and 4.
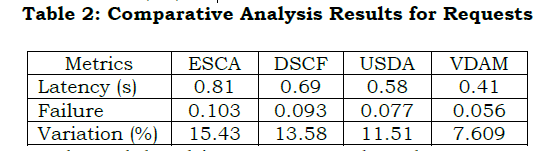
Inference: The proposed model achieves 13.69% less latency, 10.5% less failure, and 5.9% less variation.
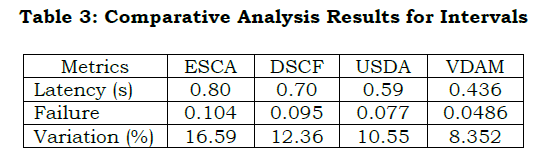
Inference: The proposed VDAM reduces latency, failure, and variation by 12.47%, 13.02%, and 4.8%, respectively.
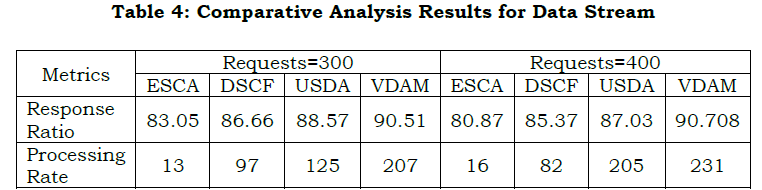
Inference: The proposed model achieves a 10.4% high response ratio and a 20.72% high processing rate for 300 requests. For 400 requests, it improves the response ratio and processing rate by 12.57% and 18.76%, respectively.
5. Conclusion
In this paper, variant data analytical model for unpredictable and unbalanced wearable sensor input streams is presented. This model utilizes data size, source density, and priority of the stream for processing it at the initial stage. The processing is carried out in a predictive manner depending on the previous data streams using the classifier learning. Depending on the classifier recommendations, the training instances are identified, and variations are estimated. This estimation aids parallel sensor data stream analysis, preventing additional latency in providing recommendations. The probabilistic instances and their corresponding variations in data streams are analyzed without failures in data communication. Therefore, the queuing up of intense data streams is prevented by improving the processing through recommendations. In the recommendations, time interval-dependent input segregation is pursued by streamlining data transmissions. Thus, a variation-less and training-induced data response is provided for the end-user in a synchronized manner. In the future, the inclusion of versatile indexing for non-redundant data streams is to be incorporated in the analytical model. Such indexing improves the classifier output for concurrently processing heterogeneous streams, improving the decision support of wearable sensor-based healthcare systems.
References :
[1]. Hilty, D. M., Armstrong, C. M., Luxton, D. D., Gentry, M. T., & Krupinski, E. A. (2021). A Scoping Review of Sensors, Wearables, and Remote Monitoring For Behavioral Health: Uses, Outcomes, Clinical Competencies, and Research Directions. Journal of Technology in Behavioral Science, 1-36.
[2]. Gu, Y., Zhang, T., Chen, H., Wang, F., Pu, Y., Gao, C., & Li, S. (2019). Mini review on flexible and wearable electronics for monitoring human health information. Nanoscale research letters, 14(1), 1-15.
[3]. Zhang, G. (2020). A wearable device for health management detection of multiple physiological parameters based on ZigBee wireless networks. Measurement, 165, 108168.
[4].Li, Y., Zheng, L., & Wang, X. (2019). Flexible and wearable healthcare sensors for visual reality health-monitoring. Virtual Reality & Intelligent Hardware, 1(4), 411-427.
[5]. Seçkin, A. Ç., Ateş, B., & Seçkin, M. (2023). Review on Wearable Technology in Sports: Concepts, Challenges and Opportunities. Applied Sciences, 13(18), 10399.
[6]. Shafqat, S., Kishwer, S., Rasool, R. U., Qadir, J., Amjad, T., & Ahmad, H. F. (2020). Big data analytics enhanced healthcare systems: a review. The Journal of Supercomputing, 76(3), 1754-1799.
[7]. Pan, Q., Chen, Y., Ma, X., Wang, C., & Chen, W. (2023). Application of Wearable Technologies in Fall Risk Assessment and Improvement in Patients with Peripheral Neuropathy: A Systematic Review. Journal of Sensors, 2023.
[8]. Zhang, Y., Hu, Y., Jiang, N., & Yetisen, A. K. (2023). Wearable artificial intelligence biosensor networks. Biosensors and Bioelectronics, 219, 114825.
[9].Han, Y. C., Wong, K. I., & Murray, I. (2019). Automatic synchronization of markerless video and wearable sensors for walking assessment. IEEE Sensors Journal, 19(17), 7583-7590.
[10]. Shawen, N., O'Brien, M. K., Venkatesan, S., Lonini, L., Simuni, T., Hamilton, J. L., ... & Jayaraman, A. (2020). Role of data measurement characteristics in the accurate detection of Parkinson's disease symptoms using wearable sensors. Journal of neuroengineering and rehabilitation, 17, 1-14.
[11]. Forbes, G., Massie, S., & Craw, S. (2020). Fall prediction using behavioural modelling from sensor data in smart homes. Artificial Intelligence Review, 53(2), 1071-1091.
[12]. Zhang, X. (2021). Application of human motion recognition utilizing deep learning and smart wearable device in sports. Int J Syst Assur Eng Manag .
[13]. Lattanzi, E., & Freschi, V. (2020). Evaluation of human standing balance using wearable inertial sensors: A machine learning approach. Engineering Applications of Artificial Intelligence, 94, 103812.
[14]. Figueiredo, J., Carvalho, S. P., Goncalve, D., Moreno, J. C., & Santos, C. P. (2020). Daily locomotion recognition and prediction: A kinematic data-based machine learning approach. IEEE Access, 8, 33250-33262.
[15]. Camargo, J., Flanagan, W., Csomay-Shanklin, N., Kanwar, B., & Young, A. (2021). A Machine Learning Strategy for Locomotion Classification and Parameter Estimation using Fusion of Wearable Sensors. IEEE Transactions on Biomedical Engineering.
[16]. Rubio-Solis, A., Panoutsos, G., Beltran-Perez, C., & Martinez-Hernandez, U. (2020). A multilayer interval type-2 fuzzy extreme learning machine for the recognition of walking activities and gait events using wearable sensors. Neurocomputing, 389, 42-55.
[17]. Arora, A., Chakraborty, P., & Bhatia, M. P. S. (2020). Analysis of Data from Wearable Sensors for Sleep Quality Estimation and Prediction Using Deep Learning. Arabian Journal for Science and Engineering, 45(12), 10793-10812.
[18]. Zadeh, A., Taylor, D., Bertsos, M., Tillman, T., Nosoudi, N., & Bruce, S. (2020). Predicting Sports Injuries with Wearable Technology and Data Analysis. Information Systems Frontiers, 1-15.
[19]. Alfarraj, O., & Tolba, A. (2020). Unsynchronized wearable sensor data analytics model for improving the performance of smart healthcare systems. Journal of Ambient Intelligence and Humanized Computing, 1-12.
[20]. Maman, Z. S., Chen, Y. J., Baghdadi, A., Lombardo, S., Cavuoto, L. A., & Megahed, F. M. (2020). A data analytic framework for physical fatigue management using wearable sensors. Expert Systems with Applications, 155, 113405.
[21]. Uddin, M. Z. (2019). A wearable sensor-based activity prediction system to facilitate edge computing in smart healthcare system. Journal of Parallel and Distributed Computing, 123, 46-53.
[22]. Greco, L., Ritrovato, P., & Xhafa, F. (2019). An edge-stream computing infrastructure for real-time analysis of wearable sensors data. Future Generation Computer Systems, 93, 515-528.
[23]. Fouad, H., Mahmoud, N. M., El Issawi, M. S., & Al-Feel, H. (2020). Distributed and scalable computing framework for improving request processing of wearable IoT assisted medical sensors on pervasive computing system. Computer Communications, 151, 257-265.
[24]. Tolba, A., & Al-Makhadmeh, Z. (2020). Wearable sensor-based fuzzy decision-making model for improving the prediction of human activities in rehabilitation. Measurement, 166, 108254.
[25]. Mahmud, T., Sayyed, A. S., Fattah, S. A., & Kung, S. Y. (2020). A Novel Multi-Stage Training Approach for Human Activity Recognition From Multimodal Wearable Sensor Data Using Deep Neural Network. IEEE Sensors Journal, 21(2), 1715-1726.
[26]. Zhou, Z., Yu, H., & Shi, H. (2020). Human Activity Recognition Based on Improved Bayesian Convolution Network to Analyze Health Care Data Using Wearable IoT Device. IEEE Access, 8, 86411-86418.
[27]. Alsiddiky, A., Awwad, W., Fouad, H., Hassanein, A. S., & Soliman, A. M. (2020). Priority-based data transmission using selective decision modes in wearable sensor based healthcare applications. Computer Communications, 160, 43-51.
[28]. Li, T., Fong, S., Wong, K. K., Wu, Y., Yang, X. S., & Li, X. (2020). Fusing wearable and remote sensing data streams by fast incremental learning with swarm decision table for human activity recognition. Information Fusion, 60, 41-64.
[29]. Mehmood, A., Nadeem, A., Ashraf, M., Siddiqui, M. S., Rizwan, K., & Ahsan, K. (2020). A Fall Risk Assessment Mechanism for Elderly people through Muscle Fatigue Analysis on data from Body Area Sensor Network. IEEE Sensors Journal.
[30]. Gai, Y., Wang, E., Liu, M., Xie, L., Bai, Y., Yang, Y., ... & Li, Z. (2022). A Self‐Powered Wearable Sensor for Continuous Wireless Sweat Monitoring. Small Methods, 6(10), 2200653.
[31]. https://sensor.informatik.unimannheim.de/#dataset_realworld_subject7