IMPROVING DYNAMIC URBAN DECISION-MAKING WITH DEEP REINFORCEMENT LEARNING AND PATTERN EXTRACTION IN NEXT-GENERATION SMART CITIES
Authors :
Anita Devi and Faridah Binti Rahim
Address :
Department of Blockchain Technology, Universiti Teknologi Malaysia, Malaysia
Department of Robotics, Monash University Malaysia, Malaysia
Abstract :
Traffic management system (TMS) aims to create environmentally friendly, efficient, and safe mobility by organizing, controlling, and optimizing traffic flow within transportation networks. Traditional methods of traffic control are inadequate in today's dynamic smart city. The major focus of this research is on improving traffic flow and decreasing congestion in dynamic urban environments. This research presents a new method, DRLPE-TMS, to enhance the TMS's ability to make real-time decisions by combining deep reinforcement learning (DRL) with pattern extraction (PE) techniques. This approach involves teaching a DRL agent to monitor and react to a digital metropolis to determine how to time traffic lights. The system searches through current and past data to identify repetitive or anomalous traffic patterns, employing pattern extraction methods. Through the integration of several methodologies, adaptive traffic management can react to both short-term events and longer-term patterns. The system's efficiency is evaluated in a massive metro area model alongside more traditional fixed-time and variable traffic management approaches. The results were a 15% increase in energy efficiency, a 25% drop in average travel times, and a 30% decrease in traffic congestion. The system can also adjust to sudden changes, such when roads are closed due to accidents. The results of this study form the groundwork for smart city traffic management in the future to be more adaptive, efficient, and environmentally friendly.
Keywords :
Traffic Management System, Smart city, Deep Reinforcement Learning, Pattern Extraction, Congestion control.
1.Introduction
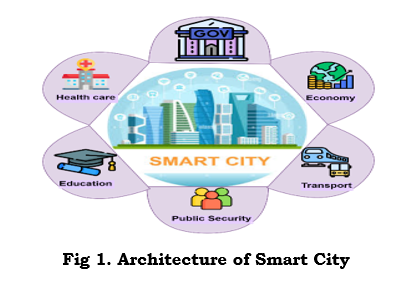
A "smart city" is a metro area that collects data from multiple sources and uses it to enhance its citizens' lives through the IoT and remote sensors. To monitor and manage smart cities, apps utilize wireless sensor networks (WSN) with minimal power and data transfer rates. [1]. A wide range of societal services, including transportation, healthcare, education, and more, are being improved, expanded, and made more efficient by smart cities, which are expanding at a rapid pace. Two components of a sustainable smart city are improved services and faster delivery of services [2], as shown in Figure 1.
These systems allow for the control and monitoring of urban systems, including water supply systems, electricity grids, and transportation networks, in real time, which helps with the adaptive response to new circumstances and needs [3]. With the help of new technologies, cities can implement solutions that will sustainably guarantee their development. Intelligent cities are those that implement such solutions. To ensure they work well economically, socially, culturally, and environmentally, environmentally conscious towns are built on multiple pillars [4]. The term "intelligent transportation systems" (ITS) is commonly used to describe transit and transportation networks that incorporate sensing, communication, and information technologies. The smart cities of the future will most certainly include ITS. Autonomous vehicles, traveller information systems, public transportation system management, and road traffic management are just a few of the services and applications that will be a part of it [5]. Modern wireless communication has made the IoT possible, and the Internet has played a key part in its proliferation. Smart city solutions improve energy management using communication and networking technology in reaction to the problems caused by urbanization and population expansion [6]. One of the most important areas to address in dealing with the growth and sustainability of smart cities is reducing energy usage. An effective plan to save power and cut costs is possible [7]. Intelligent services provide many benefits, such as increasing capacity, sharing resources and infrastructure, increasing flexibility, and offering improved Quality of Experience (QoE) and Quality of Service (QoS) approaches based on the location of the support systems and services needed. These services improve the lives of citizens and make their experiences with them more pleasant. [8].
To put it simply, the goal of the traffic estimation problem is to use the available traffic data and various AI algorithms to estimate parameters relating to traffic volumes, typically across periods ranging from fifteen minutes to several hours. It is common practice to track and predict congestion based on five metrics: trip time, occupancy, congestion rate, traffic volume, and congestion. The overload parameters are evaluated using several AI techniques, which vary according on the data type [9]. Smart cities are a new way of thinking about city design and development to improve transportation and address other critical urban issues. The effective regulation of traffic flow, elimination of congestion, and growth in intermodal connection are all ways in which smart cities use modern technology to reduce pollutants in the air and carbon emissions [10].
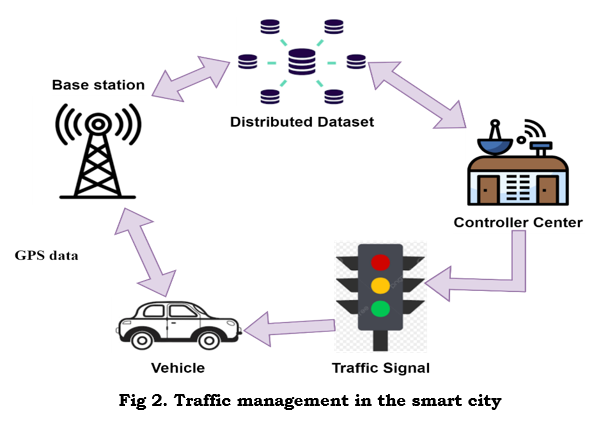
Artificial intelligence has recently made significant advances, especially in data analytics and machine learning, opening new avenues for addressing these intricate urban problems. One branch of machine learning called Deep Reinforcement Learning (DRL) has successfully handled sequential decision-making issues in unpredictable settings. At the same time, methods for extracting patterns from datasets have proven to be effective in revealing previously unseen correlations and patterns. With the use of this state-of-the-art technology, this study intends to transform the way cities handle traffic. The system DRLPE-TMS for dynamic urban decision-making is proposed by integrating the flexible decision-making abilities of DRL with the perceptive pattern detection of data mining techniques. Sustainable and efficient urban transportation systems are the focus of this research. This research can improve urban transportation by enabling smarter and more proactive traffic management, reducing emissions, reducing congestion, increasing road safety, and lowering fuel costs. Figure 2 shows the traffic management of the smart city.
The main significance
In summary, section 3 delves into the methodology of the proposed framework, encompassing the development of DRL agents, the execution of algorithms for pattern extraction, and the incorporation of all these parts into an integrated traffic management system. Section 4 shows the results of the proposed methodology, and Section 5 concludes the study with future work.
2. Literature Review
A study by Lilhore, U. K. et al. [11] demonstrated creating and implementing an Adaptive Traffic management system (ATM) that uses machine learning and the Internet of Things. Its primary building blocks are vehicles, infrastructure, and events. It used various scenarios to account for all transportation-related issues. The ATM system uses the ML-based DBSCAN clustering technique to pinpoint any inadvertent outlier further. The experimental results demonstrate, contrasted with the standard approach to traffic management, that the ATM system provides the optimal transportation planning for smart city-based transport systems.
The FITSCS-VN system, proposed by Saleem M. et al. [12], collects traffic data using ML techniques and directs traffic on feasible paths to alleviate smart city traffic congestion. The FITCCS-VN system provides drivers with state-of-the-art technologies to alleviate congestion in traffic, and the suggested model enhances traffic flow. The FITCCS-VN method outperforms its predecessors with a 5% miss and 95% accuracy rates. keep tabs on traffic conditions and road congestion from a distance.
To maximize the efficiency of traffic flow at intersections, Joo, H. et al. [13] suggest a Q-learning-based TSC system that would balance the signals in both directions and reduce delays. It manages numerous vehicles at once, which alleviates congestion. According to the data, the proposed solution greatly improved the balance of queue lengths, reduced waiting time by 15%, and cut average queue length by 25% compared to existing models.
Majumdar, S. et al. [14] presented a road network congestion propagation prediction system based on long short-term memory networks. Our model forecasts the 5-minute congestion propagation in a congested municipality using vehicle speed data from two locations' worth of traffic sensors. According to univariate and multivariate prediction analyses, the road layout determines the accuracy level, ranging from 84% to 95%. They are well-suited to forecasting the spread of congestion on road networks.
AlZoman and Alenazi used machine learning techniques to categorize network traffic [15]. The four supervised learning techniques included in it are random forests, k-nearest neighbors, decision trees, and support vector machines. Another method for traffic classification uses the most common port numbers given to applications. The evaluation findings show that the decision tree technique achieves the greatest typical precision of 99.18%, surpassing all other methods.
Ismaeel, A. G. et al. [16] offered a method based on the radial basis function (RBF) to improve smart city traffic intelligence. Deep RBF networks integrated radial basis functions' discriminative power with deep learning's generalizability and adaptability. Recurrent neural networks based on soft GRUs for improved deep learning congestion prediction: optimizing smart city traffic flow. Compared to the current models, the RBF method has an average prediction accuracy of about 4.22% greater.
Alhaj A. et al. [17] suggested a cutting-edge traffic management system that uses VANETs and the IoT to improve urban traffic efficiency and safety. The system allows vehicles and roadside units (RSUs) to exchange instantaneous data, alleviating the problems of heavy traffic and many accidents. The simulation findings show that the system effectively handles urban traffic difficulties, leading to better traffic control, faster response times in crises, and more public safety.
Iftikhar S. et al. [18] explored a thorough model for target recognition utilizing many DL approaches to keep an eye on the target in complicated traffic scenarios. It uses UAV picture training for both 1-stage and 2-stage detectors. Further analysis of the assessment work led to design optimization, reduced computing cost, and improved accuracy. In target detection, 1-stage detectors were widely utilized because of its fast detection rate. However, 2-stage detectors aren't often utilized for target detection because they are slow.
3. Proposed Methodology
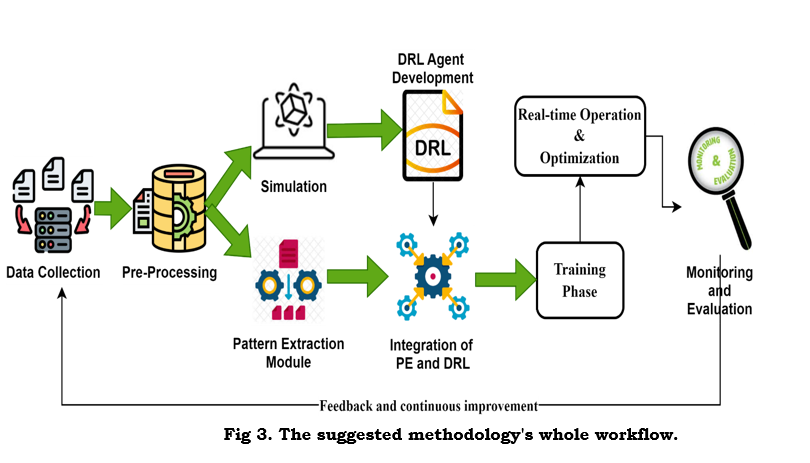
Figure 3 illustrates the general procedure of the suggested approach. By integrating DRL with PE, the DRLPE-TMS method enhances city traffic management. It begins with data collection from various sources, followed by data preprocessing. The next step is to create an accurate traffic simulation setting and train a DRL agent to maximize the traffic flow inside it. Simultaneously, a PE module examines past data for trends and outliers. The DRL and PE combination allows for reactive and predictive traffic management. The technology is designed to work in real-time, constantly adjusting to new traffic situations through learning. A feedback loop guarantees continuous improvement through continuous monitoring of performance. This method generates a strong, adaptable solution to complicated urban traffic problems by integrating short-term reactions with long-term pattern recognition. The following sections explain the workflow of the proposed method in detail.
3.1 Data collection and preprocessing
The first step in this process is gathering extensive data from various sources in an urban setting. Real-time information can be collected from automobile GPS systems, traffic cameras, and induction loop sensors mounted on the road surface. The raw data is carefully pre-processed to remove statistical outliers and improve quality. It addresses missing values using various strategies to guarantee comprehensive data. Data normalization, the last part of this phase, is essential because it standardizes the many data streams across scales and units, making it easier for the subsequent phases of the traffic management system to analyze the data consistently and accurately. Data normalization can be calculated as in equation 1.

where y is the original value min(y) and max(y) range from lowest to highest possible values in the dataset.
3.2 Microscopic Traffic Simulation with SUMO
The Simulation of Urban MObility (SUMO) is an effective program for simulating traffic at the microscopic level. In this scenario, a microscopic model captures every vehicle's motion, relations, and activities on the road network. This simulation is based on real-world traffic data; thus it can study dynamic traffic patterns. By incorporating OpenStreetMap data, the simulation can portray smart city traffic patterns, crossroads, and road layouts as accurately as possible, creating an environment that is as close to reality as possible.
3.2.1 Road Network Based on OpenStreetMap Data
An open-source and comprehensive road network map of the world is provided by OpenStreetMap (OSM). Streets, intersections, and traffic infrastructures (such as lanes and speed limits) are faithfully replicated by SUMO through the import of OSM data. The original OSM data is converted into a SUMO-compatible format so that the microscopic model can accurately mimic city traffic. The road network contains road hierarchy (e.g., highways, city streets), speed limits, and lane configurations.
3.2.2 Vehicle Types, Traffic Demand, and Traffic Light Configurations
Specific factors such as length, maximum speed, acceleration, and deceleration describe different types of vehicles, such as cars, buses, and trucks. To configure traffic demand, this method can use either origin-destination pairs or predetermined flows, which show the entry and departure points of the network for cars. The layout of traffic lights is determined by either manually preset schedules or the actual timing of traffic signals as recorded in OSM data. The simulation can test different traffic light methods by adjusting these configurations, which impact vehicle movement and congestion dynamics.
3.2.3 Algorithm for Basic Vehicle Movement
 	For each time step t in the simulation:
					a.1) For each vehicle v in the simulation:
						Calculate Desired Speed:
						Get the speed limit of the current road segment.
						Get the distance to the leading vehicle,if any.
						Get the state of any nearby traffic signals
					(e.g.,red,green).
						Calculate the desired speed based on:
						Speed limit of the road.
						Maintaining a safe following distance from
					the vehicle ahead.
						Decelerating if a traffic signal requires stopping
					or approaching a slower vehicle.
						Accelerating if the road ahead is clear.
						Update Position:
						Calculate the new position of the vehicle using equation 2:
					new_position=old_position+speed*timestep          (Eq.2)
						Use a small timestep (e.g.,0.1 seconds)for precise
					simulation.
						Collision Detection and Adjustment:
						Compare the updated position of vehicle v with the
					positions of nearby vehicles.
						If vehicle v is too close to another vehicle:
						Reduce speed to avoid collision.
						Trigger braking action if necessary.
						Ensure that all vehicle positions are updated without
					overlapping or causing collisions.
						Repeat for the next time step until the simulation ends.
This microscopic simulation can train and test the DRL agent in a realistic setting. The agent can devise smart control techniques and detect intricate traffic patterns due to the vehicle's complicated movements and interactions. Using simulation data (speeds, vehicle positions, and traffic light states), this DRL agent learns from its actions (such as adjusting the timing of traffic lights) in a feedback loop. Through rigorous training, DRLPE-TMS can replicate comprehensive and realistic traffic management scenarios.
3.3 Deep Reinforcement Learning (DRL) Agent Development
The DRL agent is a crucial component of the TMS due to its decision-making capabilities.
The essential features of the traffic environment are contained in the state space (𝑆) of the DRL agent, as demonstrated in equation 2. The three fundamental components are queue length (q), traffic density (ρ) (vehicles per unit length), and waiting time (ω) at intersections.

These characteristics give the agent an entire picture of the road conditions, allowing them to make smart choices.
A person's range of possible actions is defined by the action space (A). Time spent adjusting the phases of traffic signals constitutes this. Agents can control traffic flow by optimizing passage through junctions and relieving congestion based on the current condition by adjusting these durations. The representation of the action space can be found in Equation 3.

where d_ij is the time required for the stage j at intersection i. m is the quantity of junctions and n is the number of stages at each junction.
The reward function aims to incentivize the agent to achieve the most efficient traffic flow possible. Equation 4 gives the solution to this problem.

where average weighting time is the typical duration that pedestrians endure each crossing, queue length is equal to the total number of vehicles parked at intersections, throughput is as many cars as possible that can safely pass through intersections and α,β,γ considerations for weighing the significance of each phrase.
This reward function, which the agent should obey, promotes maximizing the number of cars moving through junctions while minimizing waiting durations and queue lengths.
3.4 Pattern Extraction
The system uses pattern extraction algorithms to examine historical and real-time traffic data to identify patterns, trends, and anomalies. Prophet and ARIMA (AutoRegressive Integrated Moving Average) are two methods that use past trends to predict future traffic behaviours. For instance, these models are useful for determining the locations and times of peak traffic. K-Means and Data-Based Spatial Clustering of Applications with Noise (DBSCAN) are two techniques that group comparable traffic behaviours. For example, during rush hour, traffic circumstances may produce one cluster, and later in the night, another by much lower traffic. The system employs two outlier identification approaches—Isolated Forest and One-Class SVM (Support Vector Machine)—to detect traffic behaviours that deviate significantly from the norm.
After extracting patterns and identifying outliers, the system must classify the events, differentiating between typical traffic patterns and unexpected disruptions.
Regular Events: Using data from the past, it is possible to predict typical long-term trends. For instance, traffic tends to surge and dip at regular times during school pickup or rush hour during the day. The technology can then routinely reroute traffic or change the timing of signals based on these patterns.
Sudden Disruptions: The system quickly adjusts its traffic control algorithms in response to unusual events like accidents, road closures, or high traffic volumes.
3.5 Integration of PE and DRL
The DRLPE-TMS system improves the agent's decision-making abilities by adding PE data to the agent's state space. This data considers the current traffic condition and uses historical and current data to predict trends and classifications. The DRL agent can operate with more context awareness thanks to Equation 5, which displays the integrated state representation.

where current traffic state is the real-time data representing the present conditions, predicted traffic state is the prediction of future traffic situations based on PEs. pattern classification informs the DRL agent of how unusual or typical the current situation is so that it can change its approach accordingly.
In this integrated state space, the DRL agent may react to the current traffic situation, plan, and change its strategy depending on the traffic scenario.
3.6 Training Phase
The DRL agent improves and stabilises its learning using target networks and experiences replay during training. The Q-value update is an integral component of the DRLPE-TMS system, ensuring that the traffic lights are controlled most efficiently.
In Experience Replay, the DRL agent maintains a record of past experiences or transitions using a memory buffer. Every experience has a state, an action, an outcome, and a subsequent state.
Target Network: A supplemental network stably updates the Q-values. This network's weights are updated more gradually than the core Q-network, which prevents the goal Q-values from changing too rapidly during training.
According to the Bellman equation, which the DRL algorithm uses to update the Q-values based on observed outcomes, the agent's performance will improve with time (Bellman equation 6 is as follows).

where x is the learning rate, y is the discount factor, s is the current state, a is the action, R is the reward and s^' is the next state.
3.7 Real-Time Operation and Adaptive Learning and Optimization
To enable real-time operation, incoming traffic data is continuously processed in real-time. After assessing the current traffic scenario, the DRL agent uses its policy knowledge to determine its next move. The PE module continuously updates its estimates of traffic patterns to ensure the system always uses the most current information. Adaptive Learning and Optimization aims to constantly improve the system's performance by updating it. Retaining the DRL agent with updated data is common practice to improve its decision-making abilities. To keep PE models up-to-date and accurate, it updates them to reflect changing traffic patterns. The device can effortlessly adapt to changing traffic conditions using online learning techniques.
4. Results and discussion
4.1 Dataset Explanation
Concerns about traffic and related concerns are common among residents of cities. Improvements in our knowledge of traffic patterns and information analysis would be a boon to transport planners, equipment developers, and congestion managers. Utilizing information gathered from a computer vision model, this tool facilitates the study of traffic conditions. The model can distinguish between many types of vehicles, including automobiles, motorbikes, buses, and trucks. Additional columns in the CSV file include the following: date, hours of the day, vehicle counts (CarCount, BikeCount, BusCount, TruckCount), and the total number of vehicles. Within a 15-minute timeframe, the "Total" column displays the total of all recognized vehicle kinds.
With updates every fifteen minutes, the dataset paints an extensive picture of traffic patterns over the course of a month. This dataset classifies traffic conditions as either heavy, high, normal, or low. Using this data, it is possible to gauge the severity of congestion by monitoring the traffic situation throughout the week.
4.2 Performance metrics
The performance measures used to compare the proposed DRLPE-TMS framework to established approaches include LSTM [14], Q-learning TSC [13], and ATM [11]. These metrics include Average Time Travel, Traffic Flow, Queue length, and Computational Efficiency. This makes it easier to showcase the distinctive qualities of DRLPE-TMS, a traffic management system that integrates DRL and PE.
4.2.1 Average Time Travel
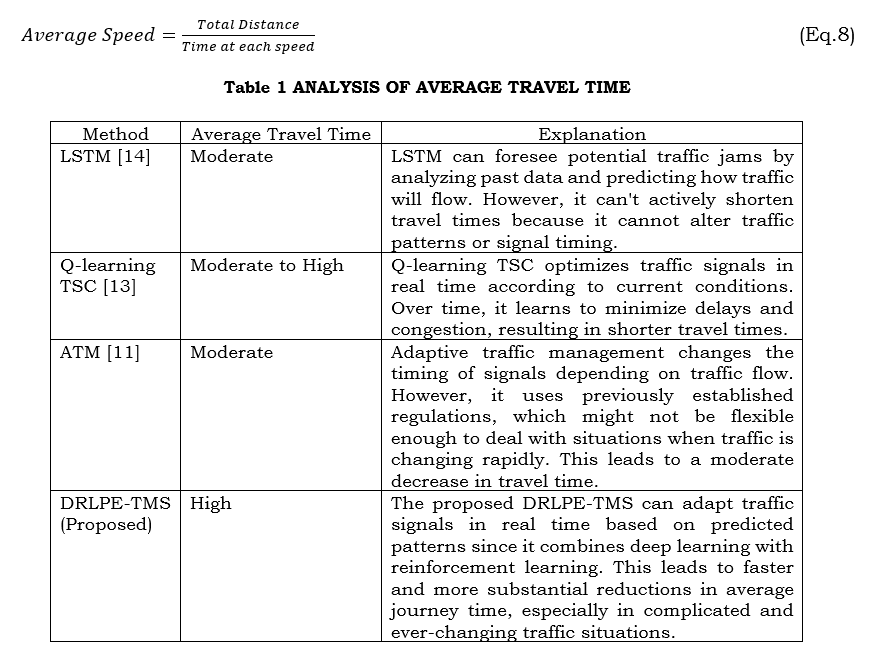
The "Average Travel Time" between two nodes in a network is the typical time it takes for a vehicle or human to make the trip. Typical travel time is affected by many factors, such as distance, speed, traffic, and mode of transportation. The basic formula for calculating it is shown in equation 7.

where Total Distance calculates the total distance traveled from start to finish place, Average Speed is the typical speed of the vehicle. If the speed changes over time, it can be calculated using Equation 8. Table 1 shows the analysis of the average travel time.
4.2.2 Queue length
In traffic systems, queue length is the number of cars waiting at a specific location, such as a toll booth or traffic light. Because longer lineups imply system congestion, inefficiency, and delays, queue length is an important statistic in traffic management. Queuing theory provides a framework for modelling queue length, which can be represented by equation 9.

where L(t) queue length at time t. θ traffic arrival rate, μ service rate, T_g duration of the green signal phase and t time for the queue has been building.
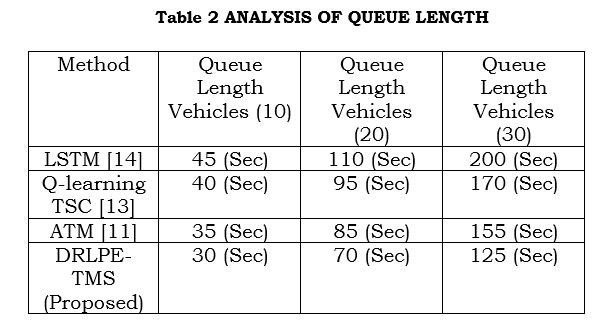
Table 2 shows the analysis of Queue Length. Congestion's compounding effects are seen in the non-linear relationship between time spent waiting in line. As queue length increases, the performance gap between methods widens, indicating that advanced methods, such as DRLPE-TMS, excel at handling heavier traffic. At more extraordinary queue lengths, DRLPE-TMS continues to outperform other approaches; for example, at 30 vehicles, DRLPE-TMS lowers waiting time by 37.5% compared to LSTM, 26.5% compared to Q-learning TSC, and 19.4% to ATM
4.2.3 Computational Efficiency
The time it takes for different methods to produce predictions or choices is called their computational efficiency. It is measurable in terms of the average time it takes to process each decision, as shown in Equation 10.

where t_i represents the time taken for each decision i, and n is the total number of decisions.
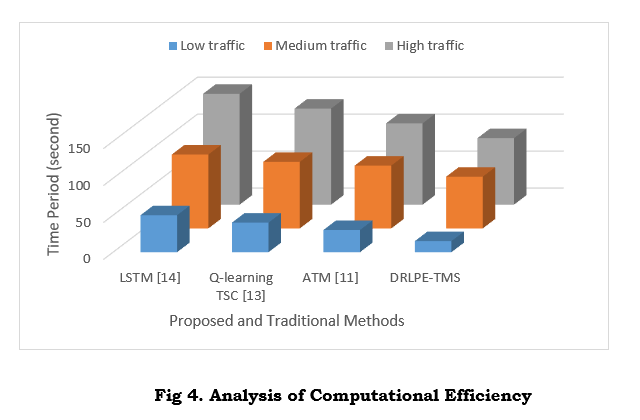
The computational efficiency analysis, which compares the suggested method to the established methods, is shown in Figure 4. The DRLPE-TMS approach demonstrates exceptional computational efficiency, as seen by its consistently lowest time to processing across all traffic conditions. Traditional methods experience higher processing times when traffic complexity increases, unlike DRLPE-TMS, which scales effectively with a lesser increase. Because the amount and complexity of the traffic affect all techniques, simulating scenarios with much traffic takes much more time than scenarios with less traffic.
5. Conclusion
The DRLPE-TMS system integrates DRL and PE methods well, significantly improving over previous smart city traffic control systems. This novel technique outperforms the status order according to key performance indicators. Queue lengths, average transit times, and processing efficiency have all been enhanced. By integrating real-time flexibility with predictive capabilities, DRLPE-TMS surpasses its predecessors and solves the complex problems of smart city traffic control. Despite older traffic control methods, this technology can detect trends in traffic and adjust to them instantly. The intricate structure of smart city transportation necessitates short-term fixes and extended planning, which the dual method provides. According to the research, the performance improvements achieved by DRLPE-TMS, especially in computational effectiveness and scalability across different traffic conditions, make it an ideal candidate for smart city deployments. It could be useful in large-scale urban settings since it can process ever-increasing data volumes with low lag time. Improved, eco-friendly, and adaptable urban transportation networks are possible thanks to the DRLPE-TMS design, that lays the groundwork for future smart traffic management systems. However, these claims need more study and verification in the real world.
References :
[1]. Sharma, H., Haque, A., & Blaabjerg, F. (2021). Machine learning in wireless sensor networks for smart cities: a survey. Electronics, 10(9), 1012.
[2]. Al Ridhawi, I., Otoum, S., Aloqaily, M., Jararweh, Y., & Baker, T. (2020). Providing secure and reliable communication for next-generation networks in smart cities. Sustainable Cities and Society, 56, 102080.
[3]. Hossam, O. M. A., & Youssef, N. A. H. (2024). Deep Learning-Based Integration of IoT and Intelligent Infrastructure: Enabling Real-Time Decision-Making in Smart Environments. Journal of Sustainable Technologies and Infrastructure Planning, 8(4), 71-90.
[4]. Wawer, M., Grzesiuk, K., & Jegorow, D. (2022). Smart mobility in a Smart City in the context of Generation Z sustainability, use of ICT, and participation. Energies, 15(13), 4651.
[5]. Abbas, Ghulam. "A Sequential Pattern Mining Method for the Individualized Detection of Online Banking Fraudulent Transactions." PatternIQ Mining.2024, (01)1, 34-44. https://doi.org/10.70023/piqm244
[6]. Mishra, P., & Singh, G. (2023). Energy management systems in sustainable smart cities based on the internet of energy: A technical review. Energies, 16(19), 6903.
[7]. Sayah, Z., Kazar, O., Lejdel, B., Laouid, A., & Ghenabzia, A. (2021). An intelligent system for energy management in smart cities based on big data and ontology. Smart and Sustainable Built Environment, 10(2), 169-192.
[8]. Mahmood, O. A., Abdellah, A. R., Muthanna, A., & Koucheryavy, A. (2022). Distributed edge computing for resource allocation in smart cities based on the IoT. Information, 13(7), 328.
[9]. Abdullah, S. M., Periyasamy, M., Kamaludeen, N. A., Towfek, S. K., Marappan, R., Kidambi Raju, S., ... & Khafaga, D. S. (2023). Optimizing traffic flow in smart cities: Soft GRU-based recurrent neural networks for enhanced congestion prediction using deep learning. Sustainability, 15(7), 5949.
[10]. Ali, S. A., Elsaid, S. A., Ateya, A. A., ElAffendi, M., & El-Latif, A. A. A. (2023). Enabling Technologies for Next-Generation Smart Cities: A Comprehensive Review and Research Directions. Future Internet, 15(12), 398.
[11]. Lilhore, U. K., Imoize, A. L., Li, C. T., Simaiya, S., Pani, S. K., Goyal, N., ... & Lee, C. C. (2022). Design and implementation of an ML and IoT based adaptive traffic-management system for smart cities. Sensors, 22(8), 2908.
[12]. Saleem, M., Abbas, S., Ghazal, T. M., Khan, M. A., Sahawneh, N., & Ahmad, M. (2022). Smart cities: Fusion-based intelligent traffic congestion control system for vehicular networks using machine learning techniques. Egyptian Informatics Journal, 23(3), 417-426.
[13]. Joo, H., Ahmed, S. H., & Lim, Y. (2020). Traffic signal control for smart cities using reinforcement learning. Computer Communications, 154, 324-330.
[14]. Majumdar, S., Subhani, M. M., Roullier, B., Anjum, A., & Zhu, R. (2021). Congestion prediction for smart sustainable cities using IoT and machine learning approaches. Sustainable Cities and Society, 64, 102500.
[15]. AlZoman, R. M., & Alenazi, M. J. (2021). A comparative study of traffic classification techniques for smart city networks. Sensors, 21(14), 4677.
[16]. Ismaeel, A. G., Mary, J., Chelliah, A., Logeshwaran, J., Mahmood, S. N., Alani, S., & Shather, A. H. (2023). Enhancing traffic intelligence in smart cities using sustainable deep radial function. Sustainability, 15(19), 14441.
[17]. Alhaj, A., Zanoon, N., Alrabea, A., Alnatsheh, H., Jawabreh, O., Abu-Faraj, M., & Ali, B. J. (2023). Improving the Smart Cities Traffic Management Systems using VANETs and IoT Features. Journal of Statistics Applications & Probability, 12(2), 405-414.
[18]. Iftikhar, S., Asim, M., Zhang, Z., Muthanna, A., Chen, J., El-Affendi, M., ... & Abd El-Latif, A. A. (2023). Target detection and recognition for traffic congestion in smart cities using deep learning-enabled UAVs: A review and analysis. Applied Sciences, 13(6), 3995.
[19]. https://www.kaggle.com/datasets/hasibullahaman/traffic-prediction-dataset